Python
PyCharm
Creating a Debug Configuration to Run Code in PyCharm
Introduction
Debugging is an essential skill for every programmer. It allows you to identify and fix issues in your code, resulting in more efficient and reliable software development. PyCharm, a popular integrated development environment (IDE) for Python, offers powerful debugging tools that can significantly enhance your development process. In this blog post, we'll walk you through the process of creating a debug configuration in PyCharm to run and debug your Python code effectively.
Step-by-Step Guide to Creating a Debug Configuration in PyCharm:
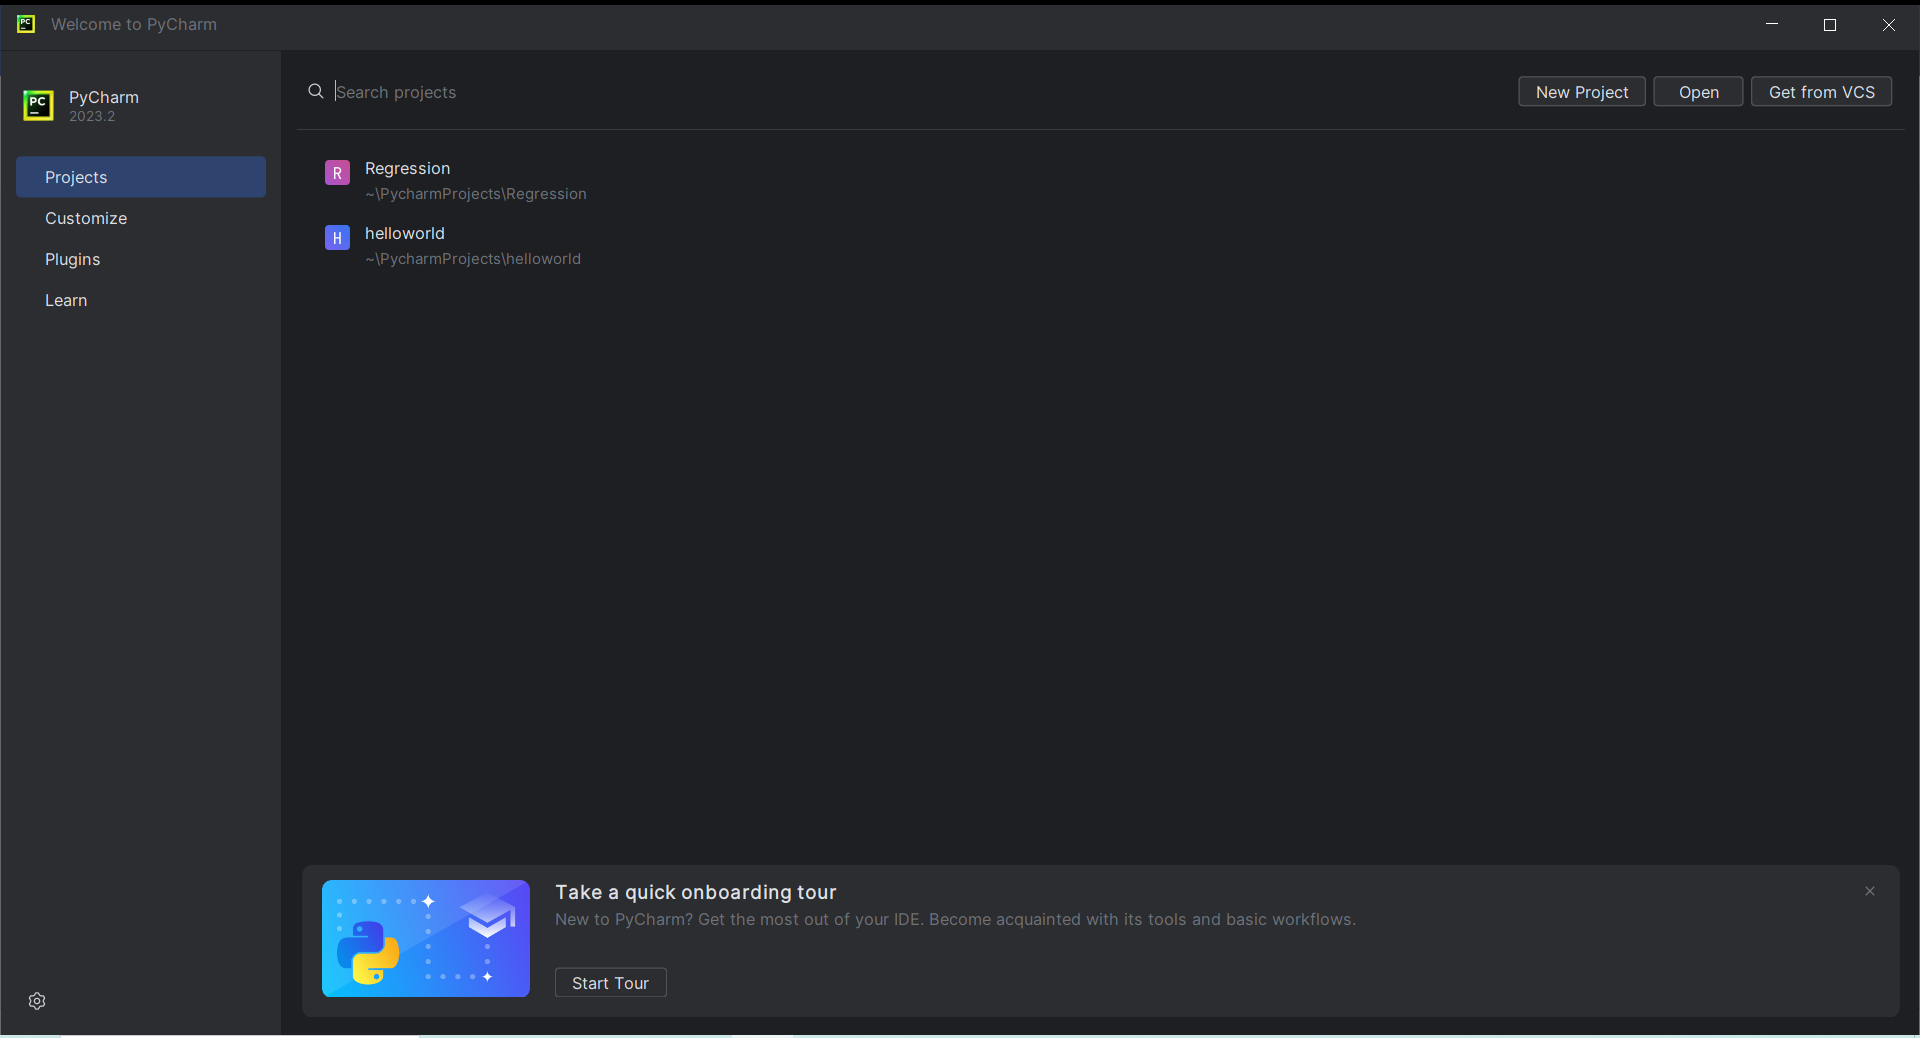
1. Open Your Project in PyCharm
Launch PyCharm and open your Python project. Make sure you have the project files loaded and visible in the IDE.

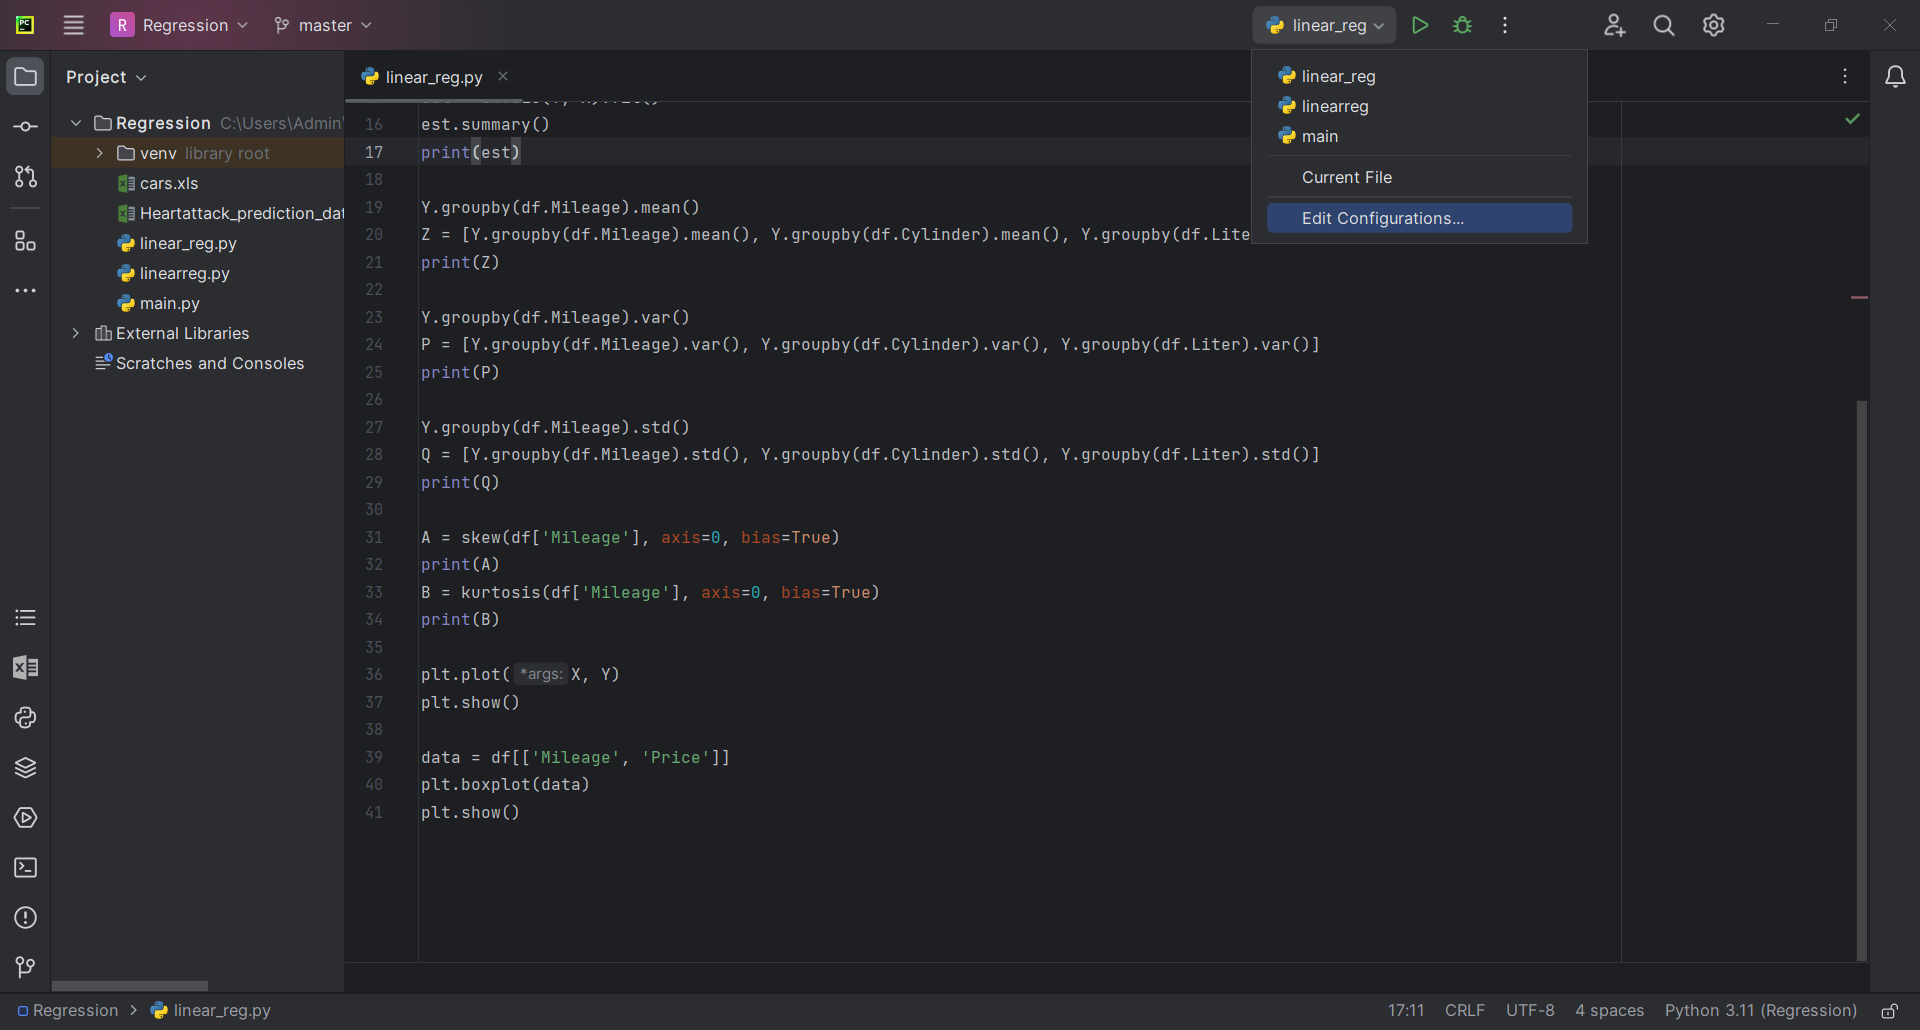
2. Navigate to Run/Debug Configurations
In the top-right corner of the PyCharm window, you'll find a dropdown menu with a green play button labeled "Edit Configurations." Click on it to open the Run/Debug Configurations dialog.

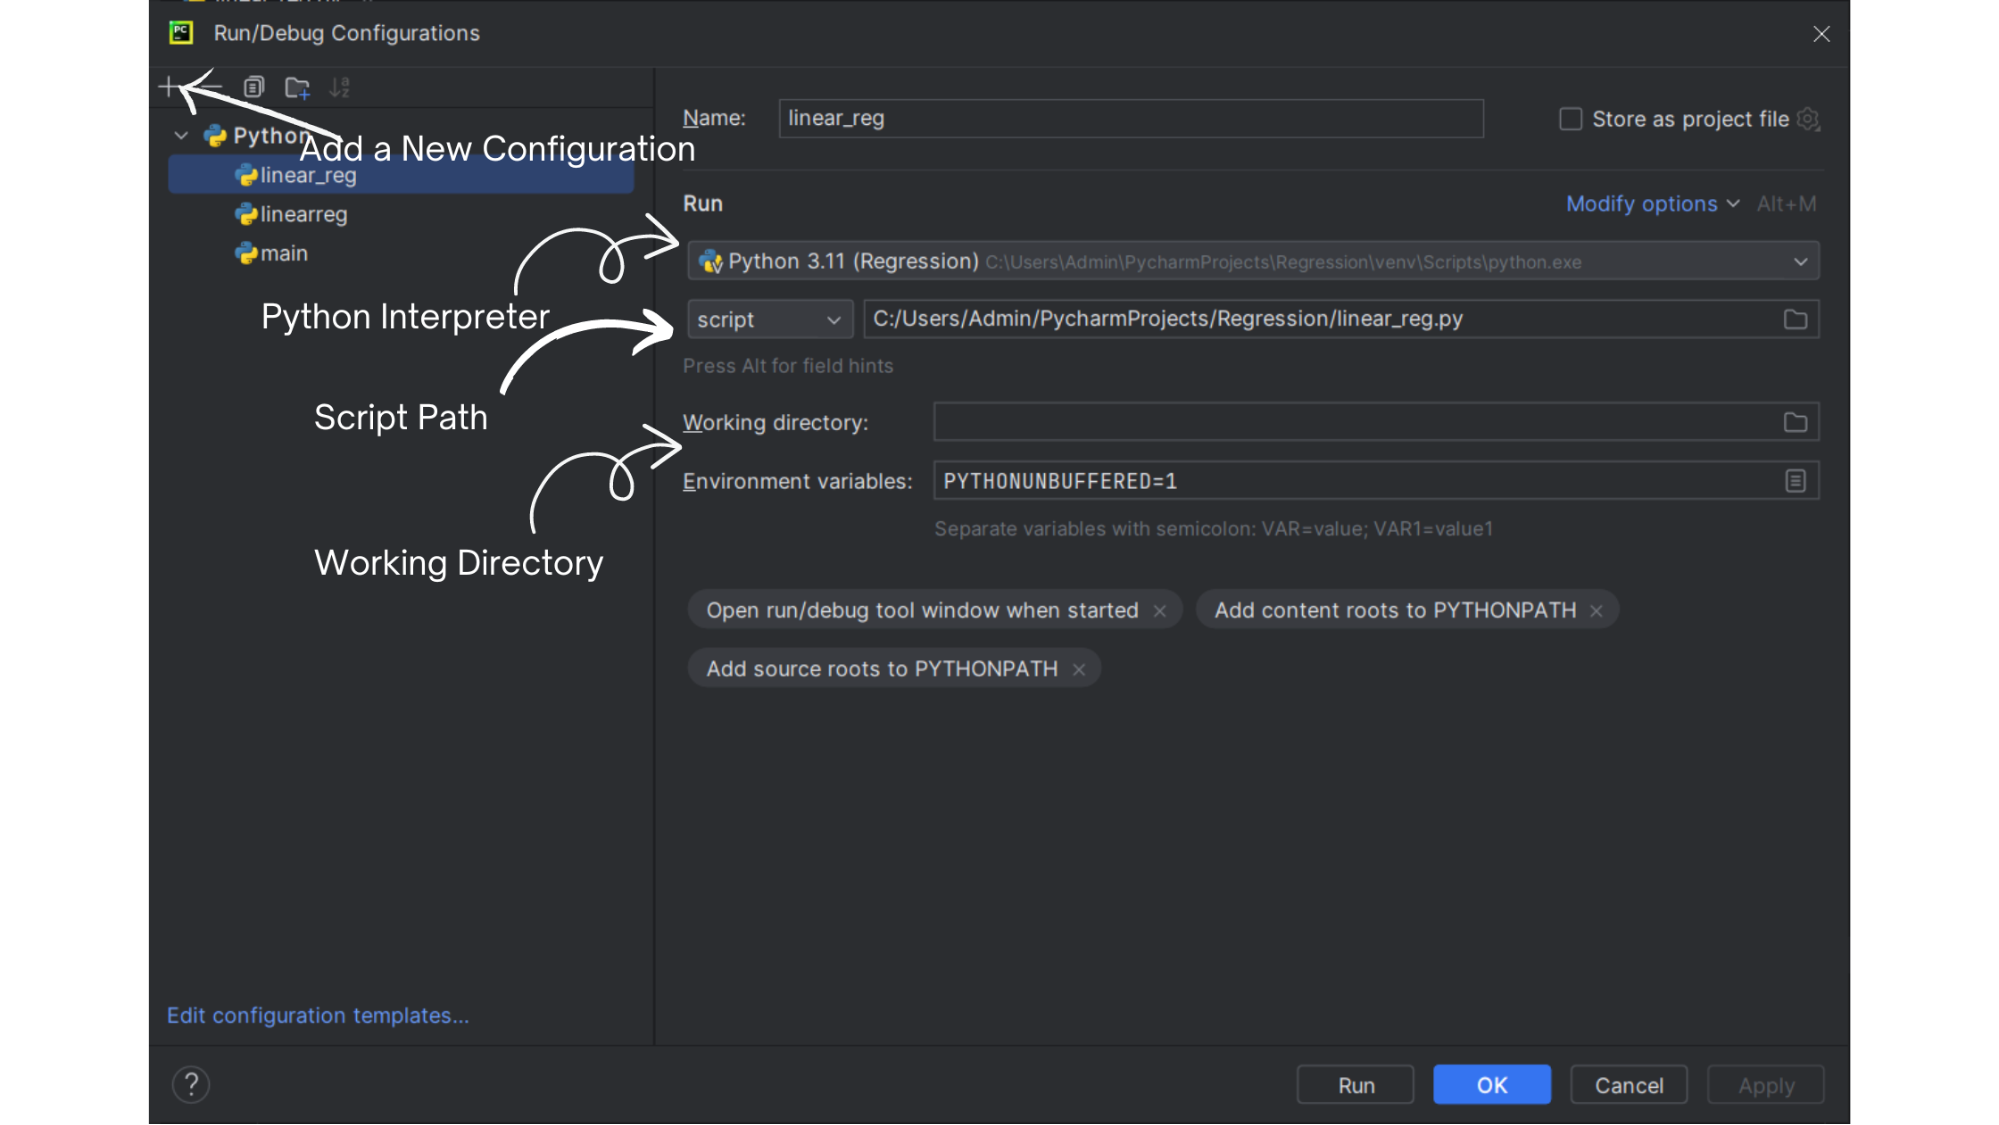
3. Add a New Configuration
In the Run/Debug Configurations dialog, click the "+" button (Add Configuration) on the top-left corner and select "Python" from the dropdown menu.

4. Configure Script Path and Working Directory
In the newly created Python configuration, you'll see fields for configuring your debug settings. Provide the path to the Python script you want to debug by clicking the "..." button next to the "Script path" field. Also, set the working directory if your script relies on specific file paths or resources.
5. Set Interpreter
Choose the Python interpreter you want to use for debugging. You can select an existing interpreter or create a virtual environment for your project.
6. Configure Debugger Options
Under the "Debugger" section, you can fine-tune your debugging experience. You can set breakpoints, enable/disable different types of exceptions, and choose how the debugger behaves.
7. Add Additional Run/Debug Options (Optional)
If your script requires command-line arguments, environment variables, or any other custom configurations, you can add them under the "Additional Options" section.
8. Apply and Save Configuration
Click the "Apply" button to save your configuration changes. You can also provide a name for your configuration so you can easily identify it later.
9. Start Debugging
With your debug configuration set up, you can now start debugging your code. Place breakpoints in your code by clicking in the left gutter of the editor. Then, click the green play button or press the "Shift + F9" shortcut to start debugging.
10. Debugging Workflow
As your code runs in debug mode, you'll have access to various debugging tools, including stepping through code (F8/F7), inspecting variables, and evaluating expressions. Utilize these tools to identify and resolve issues in your code.
11. Analyze and Fix Issues
As you step through your code, you can analyze variable values, identify logic errors, and pinpoint the source of bugs. Make necessary adjustments to your code and continue debugging until the issue is resolved.
12. End Debugging Session
Once you've successfully debugged your code and resolved the issues, you can end the debugging session by clicking the red square "Stop" button in the PyCharm toolbar.
Conclusion
Creating a debug configuration in PyCharm is a straightforward process that can significantly improve your Python development workflow. By setting up a debug configuration, you gain access to powerful debugging tools that help you identify and fix issues in your code efficiently. With the ability to set breakpoints, inspect variables, and step through code, PyCharm empowers you to write more reliable and high-quality Python applications.
Remember that effective debugging is a skill that improves over time with practice. By mastering PyCharm's debugging capabilities, you'll become a more proficient developer capable of producing cleaner and more maintainable code. Happy debugging!
