Business Intelligence
Power BI
Data Modeling In Power BI


Hi, First most if you are learning power BI then one of the most important and foundational skills to learn is Data Modelilng and even will call power BI is a power full tool for data modelling so this skill is mandatory for those in data field like data analyst ,business analyst, data science etc.
What is Data Modelling?
Data Modelling is the process of organising your data tables and giving relation between them. Imagine or think of a blueprint of how the data fits together.
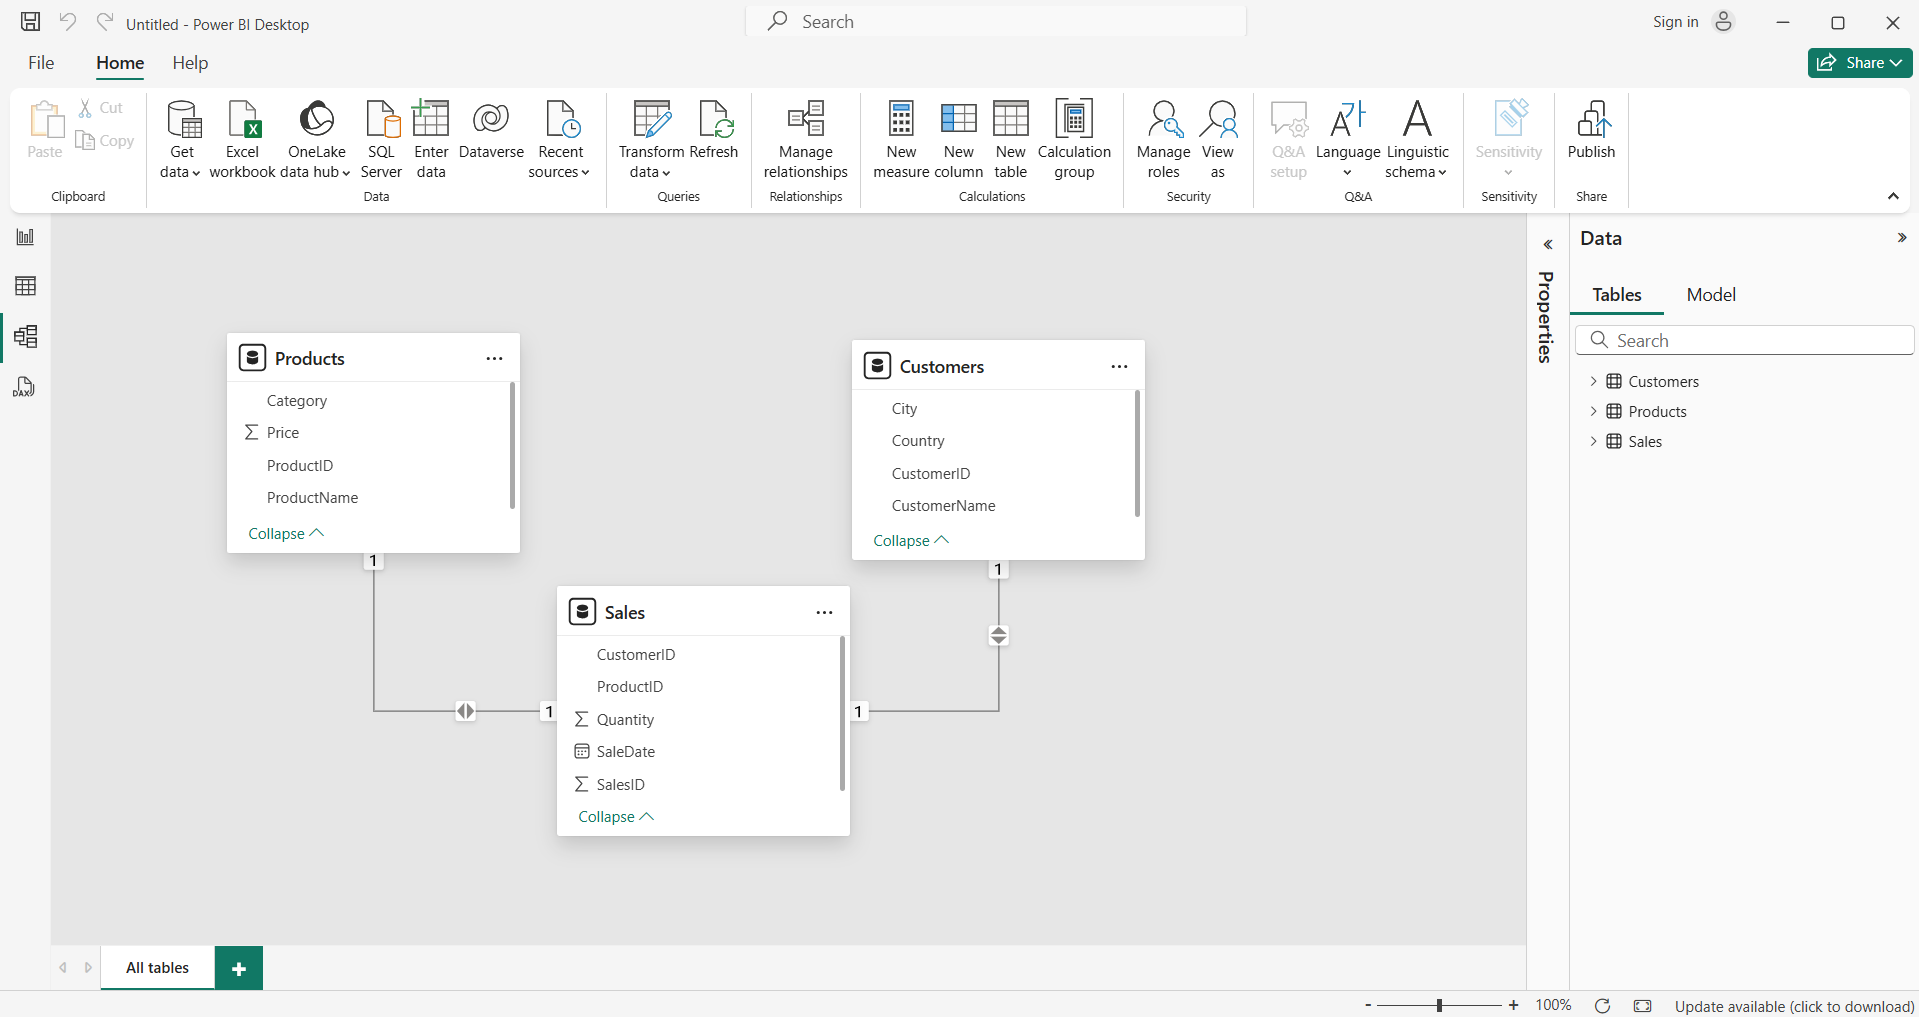
In Power BI, this happens in the Model view, where you can connect tables using keys (like CustomerID, ProductID, etc.).
In the data modelling in Power BI we have one best technique that is star schema
And other techniques but star schema is a one technique which is a very useful technique in data warehousing and data modelling. Let's see what it is.
Star schema
What is a Star Schema? (The Real-World Explanation)
Imagine you're running a business, and you've got tons of data — sales, customers, products, dates, and more. But if all that data is just thrown into one big messy spreadsheet, good luck finding anything useful.
So, what do you do? You organise.
A star schema is a simple, smart way to structure your data so you can analyse it quickly and clearly — especially in tools like Power BI, Excel, or any business intelligence platform.
Here’s how it works:
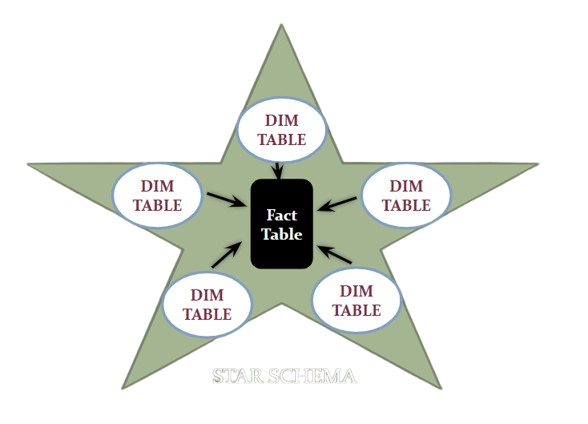
- You have one big table in the middle: This is your fact table. It holds all the action — things like sales, revenue, or quantity sold. It's mostly numbers and IDs.
- Around it are smaller supporting tables: These are your dimension tables. They describe the “who,” “what,” “when,” and “where” of each transaction — like customer names, product details, dates, or store locations.
It’s called a star schema because if you draw lines between the fact table and the dimension tables, the shape looks like a star.
Creating Relationships
To connect the tables:
- Go to the Model View in Power BI.
- Drag and drop a column from one table to another (e.g., Sales.ProductID → Products.ProductID).
- Ensure it's one-to-many (1:*) relationship — dimensions should be on the "one" side.
Cardinality and Cross Filter Direction
When building relationships, Power BI asks for:
- Cardinality: one-to-one, one-to-many, or many-to-many
- Cross Filter Direction: single or both Best Practices:
- Use a single direction unless you need both.
- Keep fact to dimension relationships (not the other way).
- Use a date dimension instead of relying on raw date fields.
- Keep your model simple — avoid circular relationships.
- Rename tables and columns to be user-friendly (no tbl_Cust — use Customers).
- Create calculated columns or measures in DAX instead of loading too much data from source.
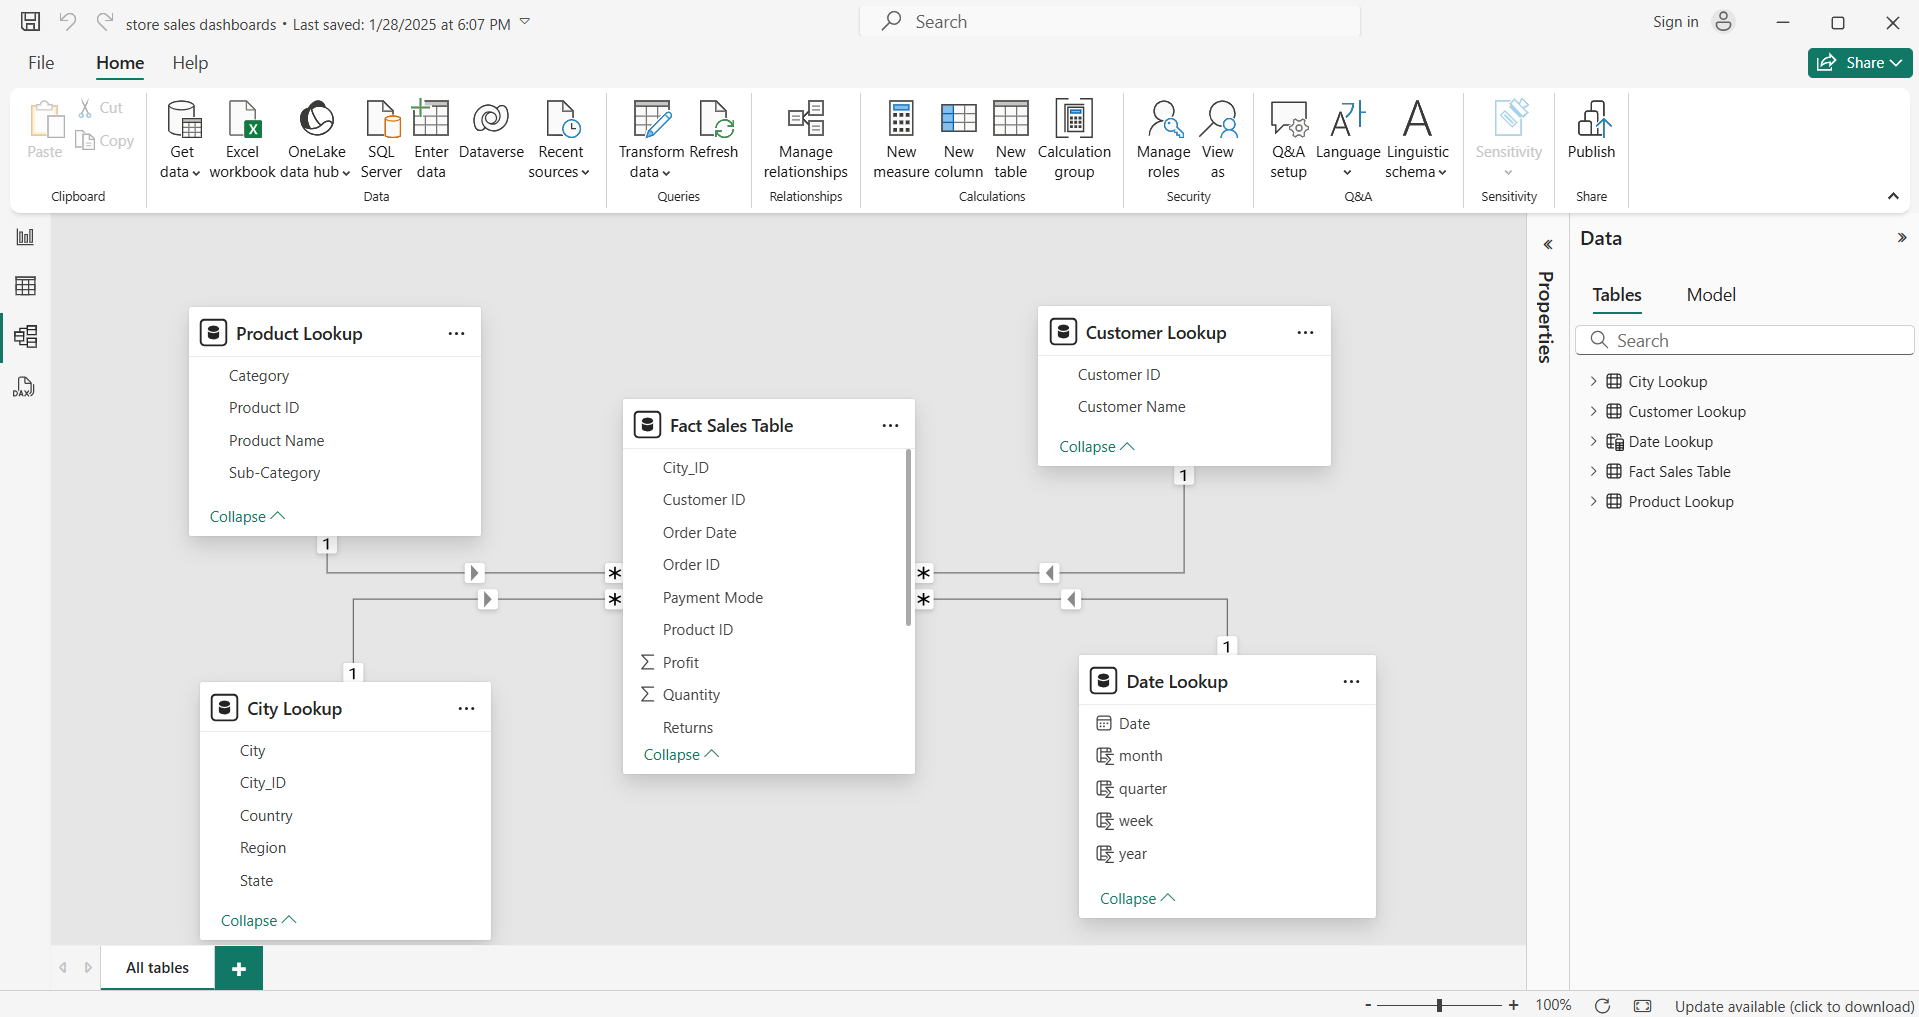
Conclusion: Getting data models is half of the work in the power BI if your data model is well created means well prepared data with the relationship then the analysis will come easily and properly build a relationship between the fact and dimension tables that we call star schema technique. And power BI is a powerful tool for data modeling that means more options are given to create tables and give the relationship with different cardinalities.
about the author
Malkanagouda Patil
Malkanagouda Patil is a data enthusiast and a content researcher. He works as a business analyst who works predominantly on deriving insights and intelligence using SQL, Power BI & Python Programming
