Power BI
Business Intelligence
Data Analytics
Understanding ETL: A Beginner's Perspective for Business Analysts


Introduction
Ever stared at a messy spreadsheet and wondered how on earth you’d turn that into anything useful?
Me too.
That’s where ETL comes in.
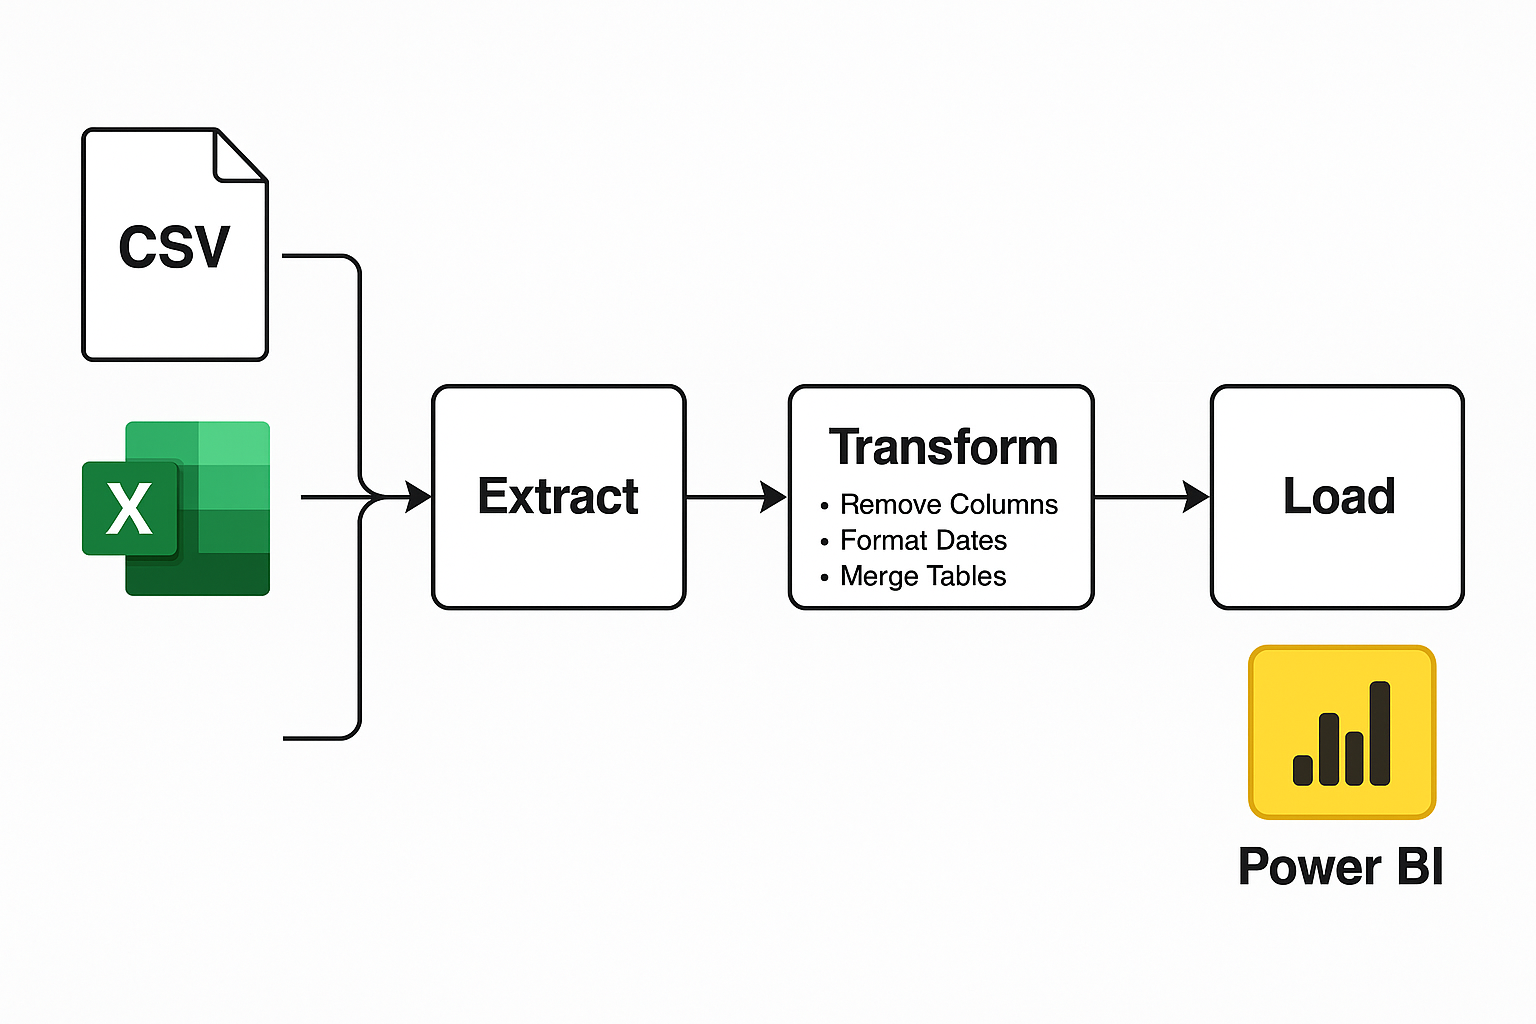
ETL stands for Extract, Transform, Load.
It’s basically the process of taking raw data—often all over the place—then cleaning it up, and finally moving it somewhere you can actually use it (think Power BI dashboards or a database).
In this guide, I’ll walk you through:
- What ETL is (in plain English, no jargon)
- Why every Business Analyst should care about it (spoiler: it saves you tons of headache)
- A practical example of ETL in action
- The tools you can try as a beginner
- Key ETL steps you’ll use over and over
Ready? Let’s go.
So…
What Exactly Is ETL?
At its core, ETL is a three-step data prep routine. Nothing magical, just logical steps that tame messy data.
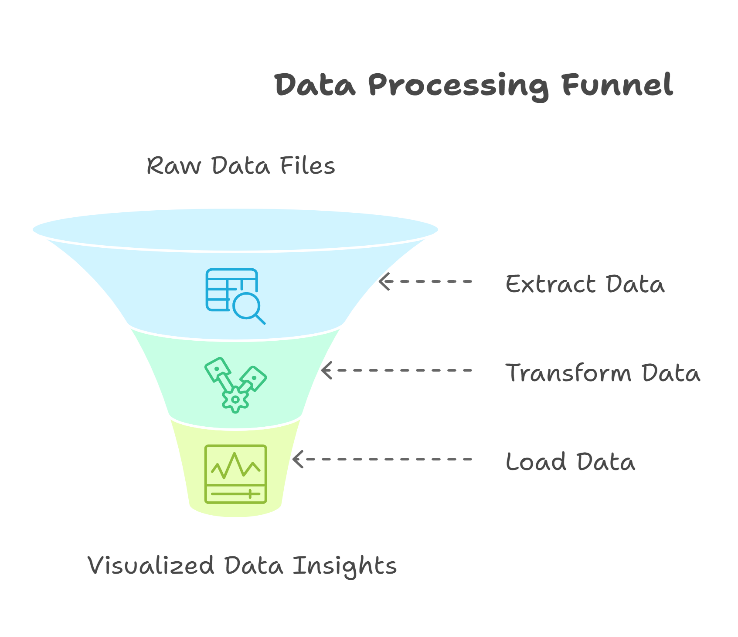
- Extract:
You grab data from wherever it lives: Excel files, SQL databases, maybe an API.
Think “collect all the ingredients.” - Transform:
You clean it: fix date formats, remove blank rows, correct typos, standardise values.
You might merge tables, calculate new fields (like profit margin), or pivot/unpivot data.
This is “cooking”—you shape and season the data so it’s tasty (aka usable).
- Load:
You send the polished data into its final home: a Power BI dashboard, a SQL table, or maybe even a CSV that someone else will pick up.
Consider it “serving the meal” for your colleagues
That’s ETL in 30 seconds. It’s simple, but the power lies in making sure each step is done right. Skip one cleanup step, and your reports could be flat-out wrong.
Why Should You, as a Business Analyst, Care?
Let’s be real: business data is messy. Different teams use different formats. Dates in one sheet might be MM/DD/YYYY while another is DD-MM-YYYY. Sales figures might be written as “1,000” in one file and “one thousand” in another.
If you try to build a report on that chaos? You’ll get garbage in, garbage out.
Here’s why ETL is your best friend:
- Consistency: You make sure every column follows the same rules. Dates look the same. Numbers are numbers, not text.
- Accuracy: You catch missing values, duplicates, weird outliers—before they mess up your insights.
- Efficiency: Once you set up your ETL steps, you can refresh it with new data without starting from scratch. Less manual wrangling.
- Collaboration: Your coworkers can tap into a clean dataset rather than each doing their own version of “data cleaning.” Less confusion, fewer mistakes.
In short, ETL frees you from the equivalent of bailing water out of a sinking boat—so you can finally focus on steering toward insights.
A Real-World ETL Example (for a Retail Sales Report)
Imagine this: you need to put together a monthly sales performance report. The company has five regional branches. Each one sends you an Excel file. And—oh joy—each file has its own quirks.
Step 1: Extract
- Download all five Excel files from regional teams.
- Run a SQL query to pull the master product list (with product names, categories, costs).
Step 2: Transform
- Remove irrelevant columns: Maybe one branch includes columns like “Store Manager Name” that you don’t need.
- Fix date formats: Some use 1/5/2023; others use 2023-01-05. Choose one format—say, YYYY-MM-DD.
- Clean blank or invalid rows: Sometimes the bottom rows are empty or have placeholders. Get rid of them.
- Standardise sales figures: Convert text like “seven hundred” to the number 700.
- Combine all five regional files into one master table.
- Join that with the product list to add product names, categories, and cost.
- Calculate a new column: profit per unit = SalePrice - Cost.
At this point, you have one tidy table with:
- Date (properly formatted)
- Region
- Product Name
- Quantity Sold
- Sale Price (numeric)
- Cost (numeric)
- Profit (calculated)
Step 3: Load
- Import the final table into Power BI.
- Build visuals: total sales by region, top 10 products, profit trends over time, etc.
- That’s it. You’ve gone from five messy, inconsistent files to a sleek dashboard. Your VP of Sales will love you.
ETL Tools You Can Start Using Today
You don’t need a PhD in data engineering to do ETL. Plenty of user-friendly tools exist, especially for Business Analysts:
Beginner Tools That Support ETL
Today’s tools make ETL accessible even to those without technical expertise. Here are a few beginner-friendly options:
| Tool | Role in ETL | Why It’s Friendly |
|---|---|---|
| Power BI (Power Query) | Extract & Transform | Drag-and-drop interface, step-by-step transformations, no coding needed |
| SQL | Extract & Transform | Full control over data queries, great for large datasets |
| Excel | Light Transform | Everyone knows it; decent for quick fixes like removing blanks and filtering rows |
| Power Automate | Automate ETL | Allows workflow automation to fetch data, trigger transformations, and save outputs |
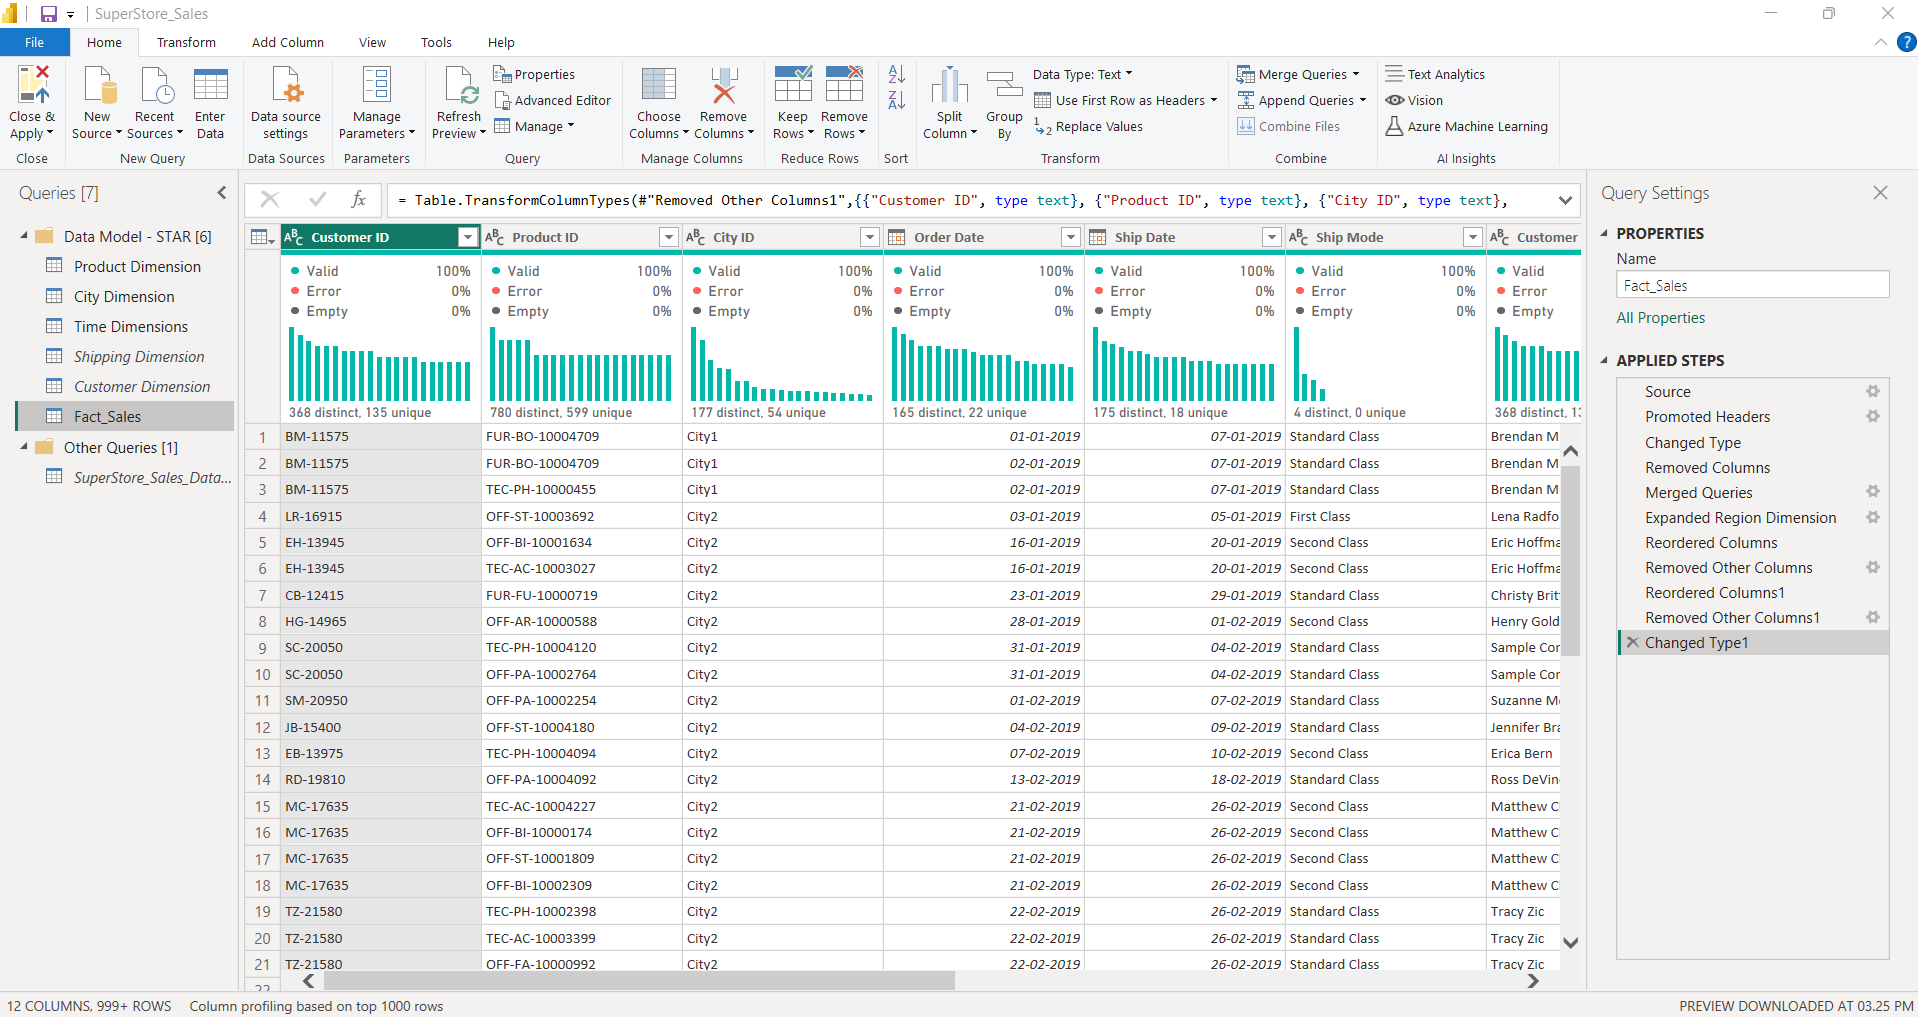
Tip: If you’re just getting started, dive into Power Query inside Power BI. It shows you each transformation step, so you can see—and later tweak—exactly how you turned raw data into a clean table.
Beyond those, you might see references to:
- Open Source: Apache NiFi, Talend Open Studio—powerful but a steeper learning curve.
- Enterprise: Informatica, IBM DataStage—big players for large companies.
- Cloud-Native: AWS Glue, Google Cloud Dataflow—great if your data lives in the cloud.
- Code-Based: Python (using libraries like Pandas, BeautifulSoup)—if you like scripting, this is extremely flexible.
- No/Low-Code: Alteryx, Microsoft Power Query—handy for people who want minimal coding.
Choose based on:
- Your skill level (no-code vs. code)
- Your budget (free vs. enterprise license)
- Where your data lives (on-prem vs. cloud)
Core ETL Actions You’ll Use All the Time
Over time, you’ll notice some ETL steps come up again and again. These are your bread-and-butter moves:
1. Assign Data Types: Make sure “Date” columns are really dates (not text). Ensure “Sales” is a number, not text.
2. Handle Nulls: Replace missing values with defaults (e.g., 0) or drop those rows/columns entirely. Filter out invalid entries.
3. Edit Columns: Split a “Full Name” column into “First Name” and “Last Name.” Merge “City” and “State” into one field if needed. Rename columns for clarity.
4. Filter Rows: Keep only rows where Sales > 0. Remove entries before a certain date (e.g., older than one year).
5. Join Tables: Use a common key (e.g., ProductID) to merge sales data with product details.
6. Pivot/Unpivot: Turn columns into rows (or vice versa) to reshape data for reporting.
7. Aggregate (Summarise): Group by “Region” and sum “Sales”. Calculate average, min, max, etc., for a given
column.
Mastering these actions means you can tackle almost any data-prep challenge that comes your way.
ETL’s Critical Role in Business Intelligence
Data that hasn’t been through ETL is like ingredients scattered across your kitchen countertops—impossible to turn into a meal unless you gather, wash, chop, and cook.
In BI work, ETL ensures you’re not just looking at raw chaos. Instead, you’re looking at a clean, consistent dataset that tells a story:
- Consolidation: Bring regional or departmental data into one place so comparisons make sense.
- Standardisation: Make sure everyone’s using the same definitions (e.g., “Revenue” means the same thing
everywhere).
- Validation: Catch mistakes—like a date that says “30/02/2023”—before they ruin your charts.
- Automation: Once your ETL steps are defined, you can refresh monthly (or daily) without starting over.
Without ETL, you either spend hours (or days) cleaning data by hand, or you make decisions based on flawed information. Neither is a good look.
Quick Comparison: ETL vs. ELT
You might have heard the acronym ELT (Extract, Load, Transform). It’s similar to ETL, but the order is different:
| Characteristic | ETL | ELT |
|---|---|---|
| When Data is Transformed | Before loading into destination | After loading into destination |
| Storage | Only transformed data stored | Raw + transformed data stored |
| Best for | On-premise systems, smaller datasets | Cloud-based systems with high compute power |
ETL: Clean data first, then load. Good if you have limited storage or need only the final table.
ELT: Load raw data into a data lake or data warehouse, then transform using powerful cloud resources.
If you’re working in Power BI or local SQL Server, ETL is usually simpler. But if your company uses Snowflake or BigQuery, you’ll see ELT workflows more often.
Conclusion
ETL isn’t just another technical step in the data workflow—it’s the part that quietly does the heavy lifting. For Business Analysts, it’s what helps turn messy, scattered data into something clean, usable, and actually meaningful.
If you're just getting into it, don’t rush. Start small. Maybe it’s a few Excel sheets, or a Power BI file that needs a little cleaning. Work through it. Get a feel for how raw data behaves—what needs fixing, what needs combining, what you can leave out. These small wins build muscle.
Over time, you’ll want to go deeper. Try automating parts of the process. Learn how SQL can give you more control. There’s no exact moment where you "master" ETL—it’s more about becoming comfortable with the mess and knowing how to tame it.
The best learning still comes from doing. No course or tutorial can match the clarity you get when you fix a broken dataset on your own. And once you've done that a few times, you start to see patterns—ways to work smarter, not harder.
Also, stay curious. Keep an eye on new tools, new ways of working. ETL is changing, and staying up to date isn’t about chasing trends—it’s about making your life easier and your insights stronger.
In short, ETL is what lets you spend less time fixing data—and more time using it to answer the real questions.
about the author
ShashiKumar G N
I am currently pursuing an internship in Advanced Business Analytics, focusing on tools like Power BI, SQL, and data visualization. With a growing interest in data preparation and automation, I aim to bridge the gap between raw data and actionable insights for informed business decisions.
