Data Analytics
POWER BI [BUSINESS INTELLIGENCE]


Microsoft Power BI (Business Intelligence) is a tool for Data Analytics and Business Analytics that makes complex data more straightforward, clean, and structured. Power BI provides the services of connecting us to hundreds of data sources and is a powerful tool for creating impactful visualization, reports, and dashboard.
Three Power BI Tools
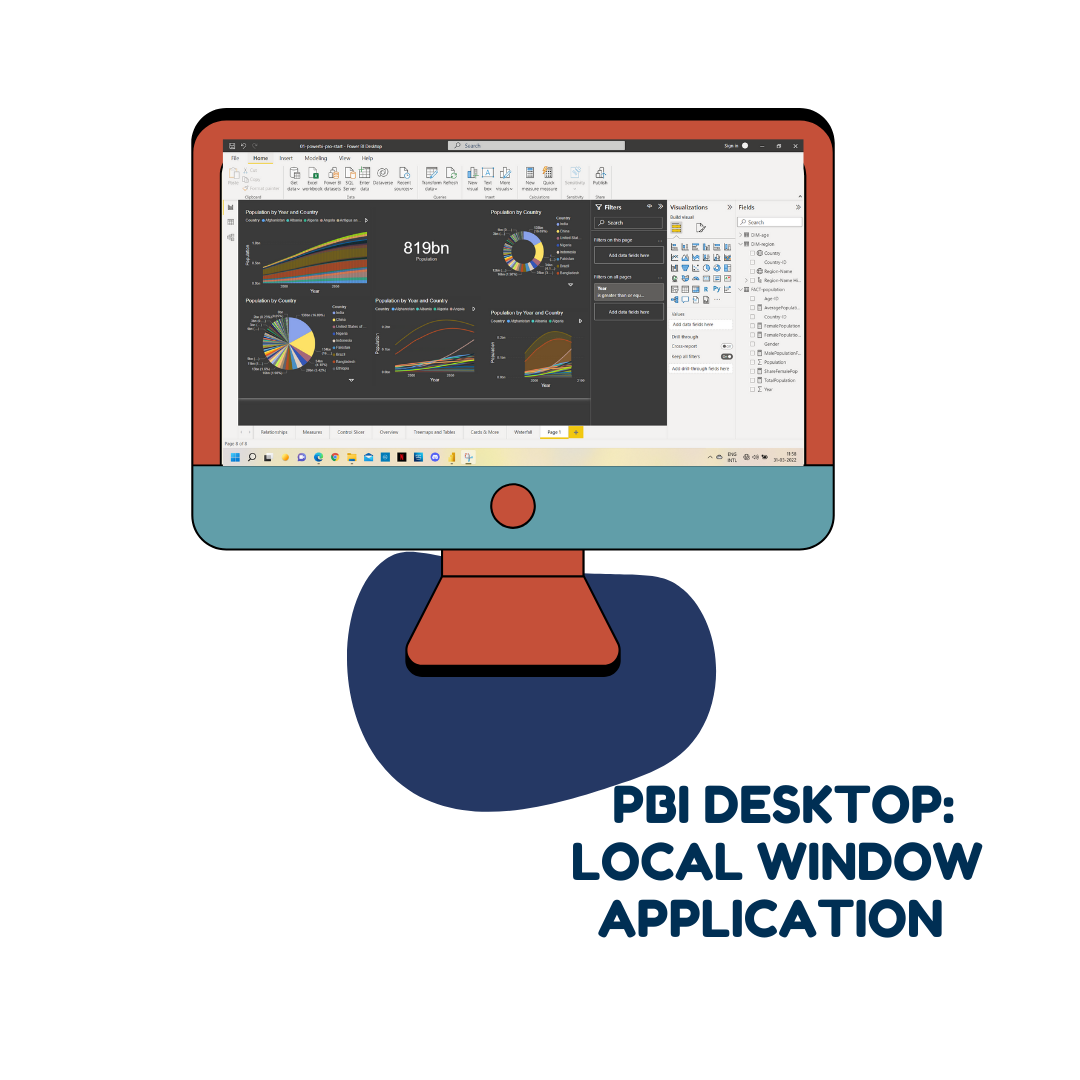
Power BI Desktop:
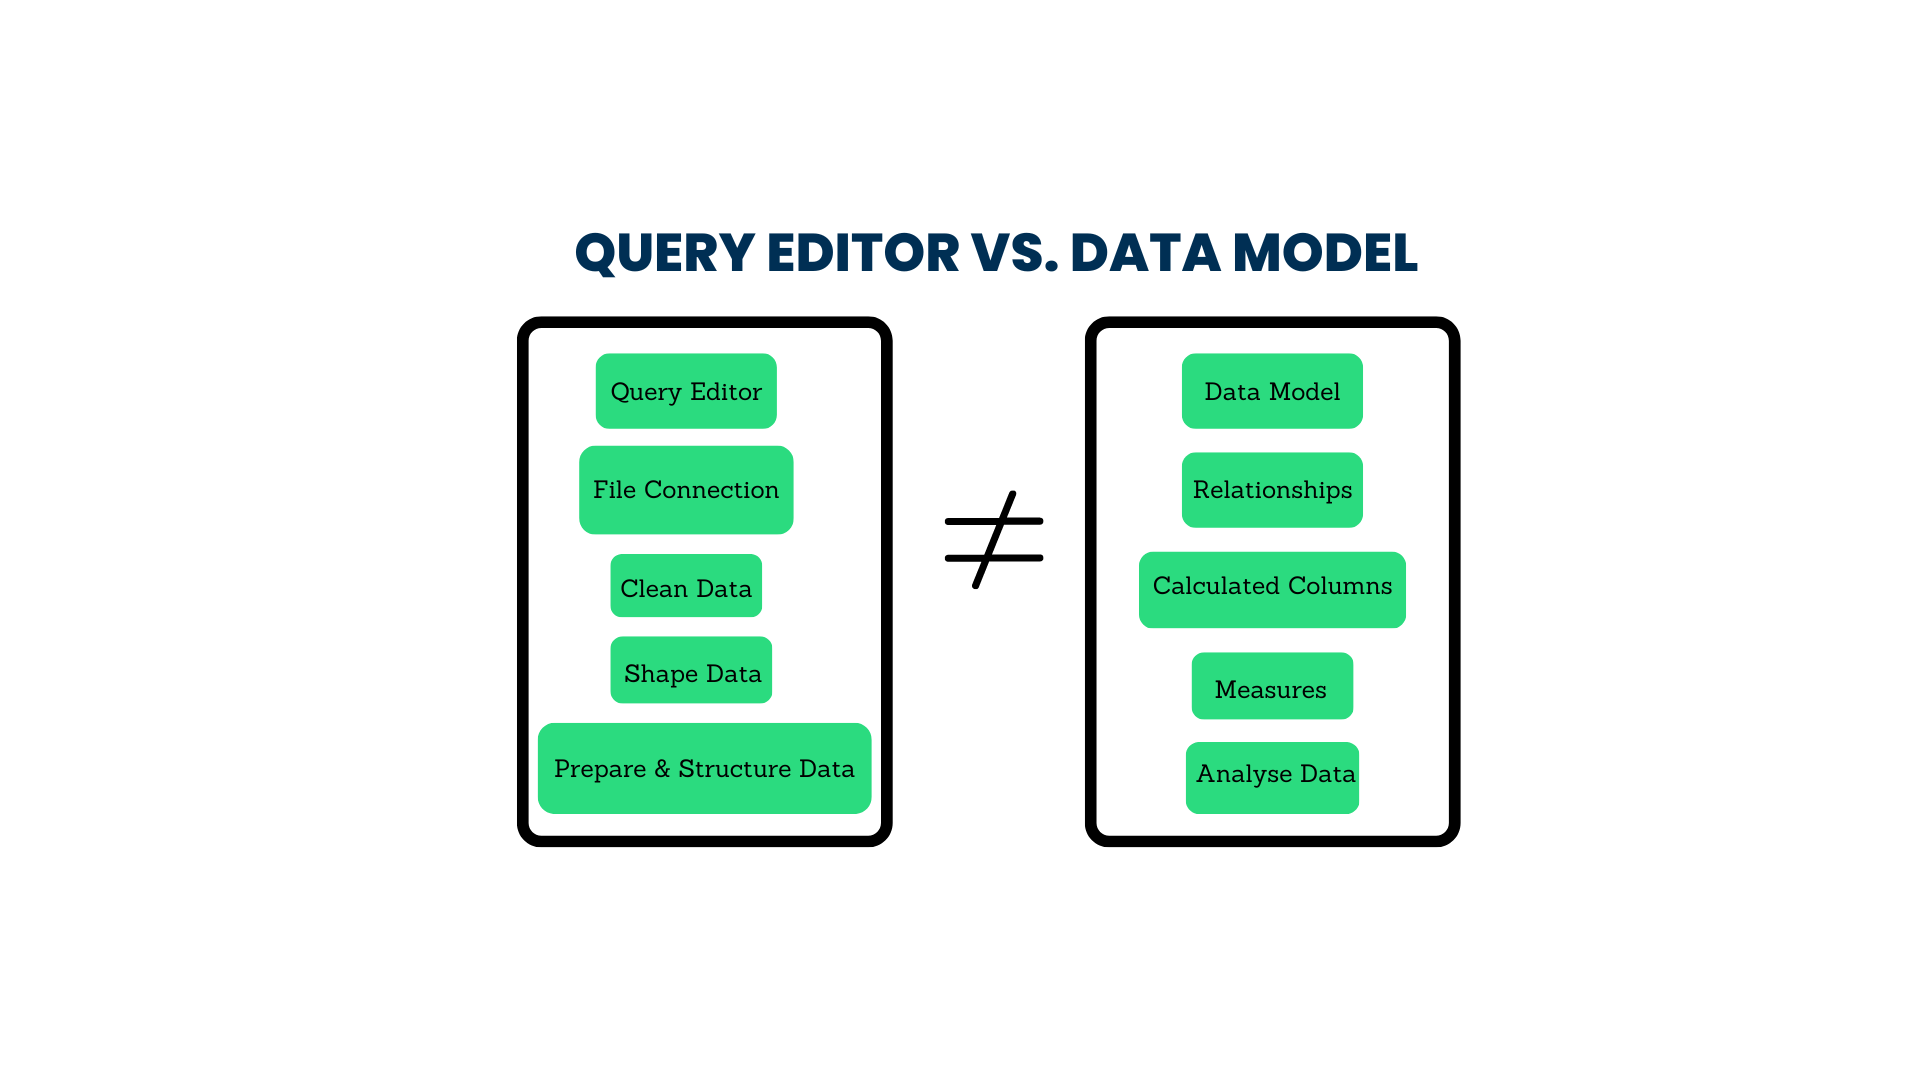
Power Desktop is a free local window application. Data Model (Desktop) and Power Query Editor are the two key components of the Power BI Desktop. We connect raw data to Power BI Desktop and transform it using the Query Editor. To further make data clean, shaped, formatted, and simple, we do all the actions on the raw data in Power Query Editor (i.e., shaping, cleaning, pre-processing, formatting, error handling, and many more). Then we apply this clean data from the Query Editor to the Data Model. Data Model is the place where we can create powerful visuals and reports. We gain insights into the data, or what the data is communicating, using Visuals and Reports.
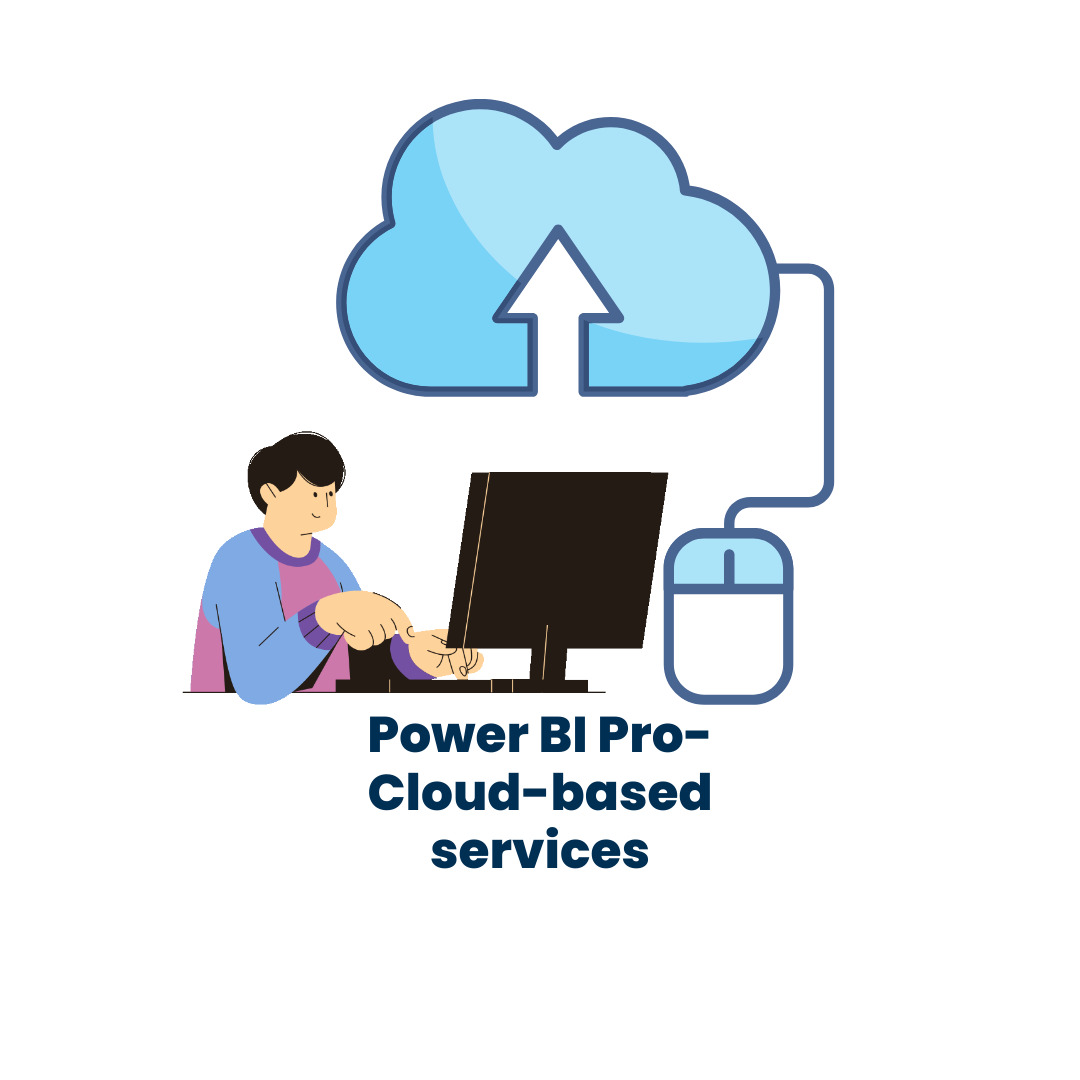
 Power BI Services(Pro):
Power BI Pro is Cloud-based services. It is a place where we prepare and edit reports and dashboards. It provides collaboration and sharing services, where people can work together on the cloud with a collab and share information. We can prepare reports, dashboards, and visualizations in Power BI Pro, but we cannot undertake data preparation here. In addition, we can use Pro to create an application.
 Power BI Mobile:
It is an End-user-Application. With the application, one can access the project created on Power BI from anywhere. On mobile, you can connect to and interact with your cloud and view visuals, reports, and dashboards.

Three Core Areas of Power BI
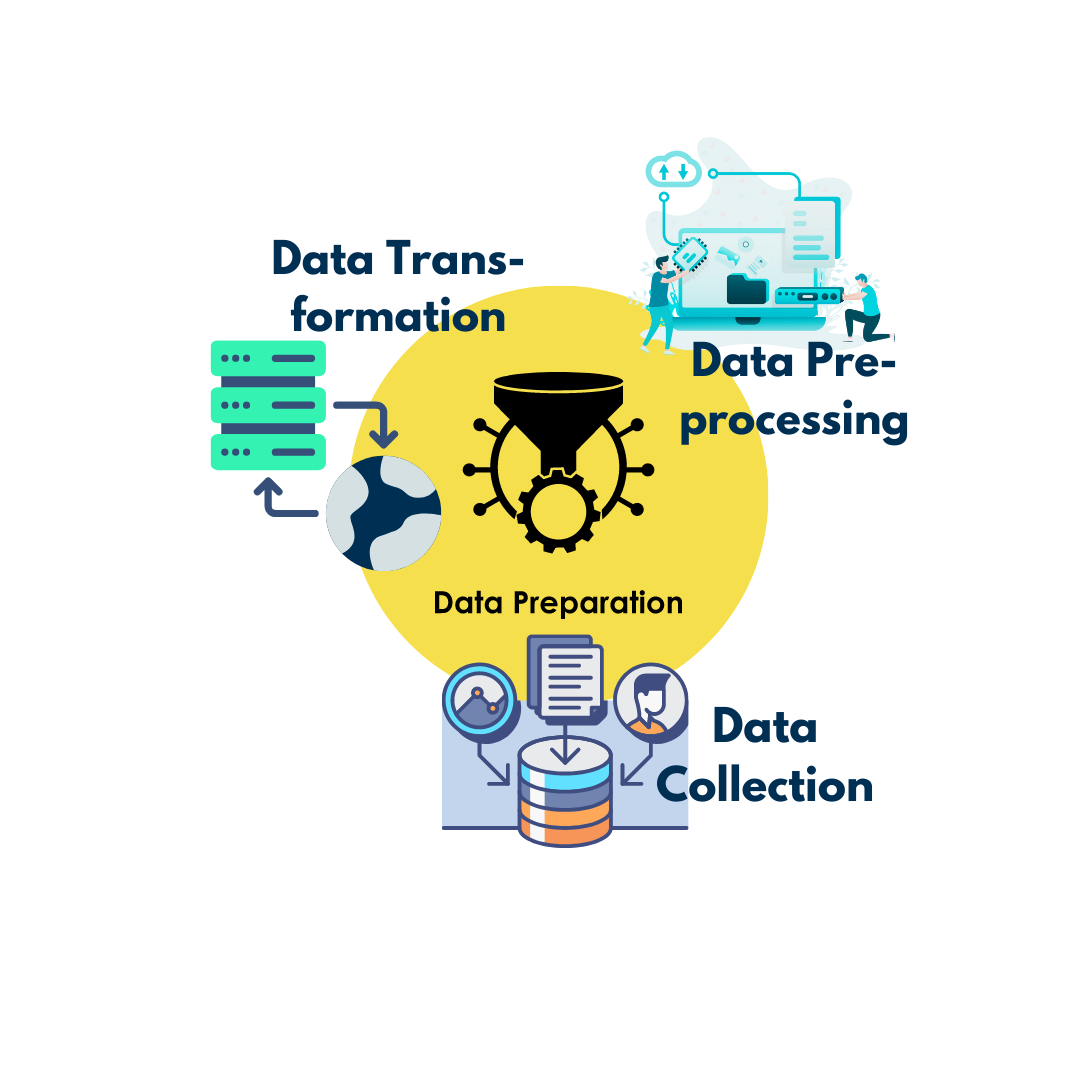
Data Preparation:
It is a part of the Power BI Desktop that involves getting raw data, cleaning, shaping, formatting, error handling, etc., and converting it into clean and shaped data with required features.
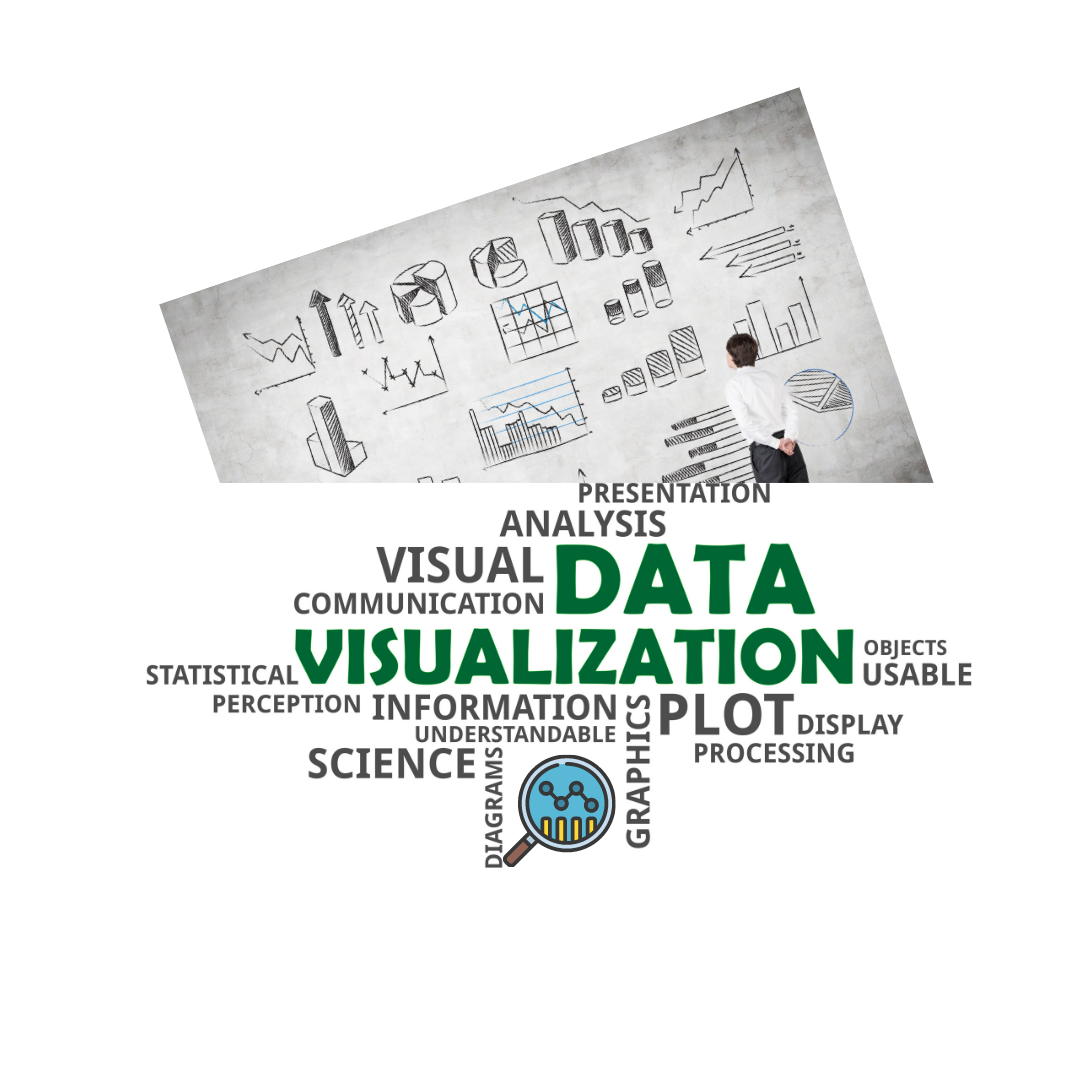
 Visualization:
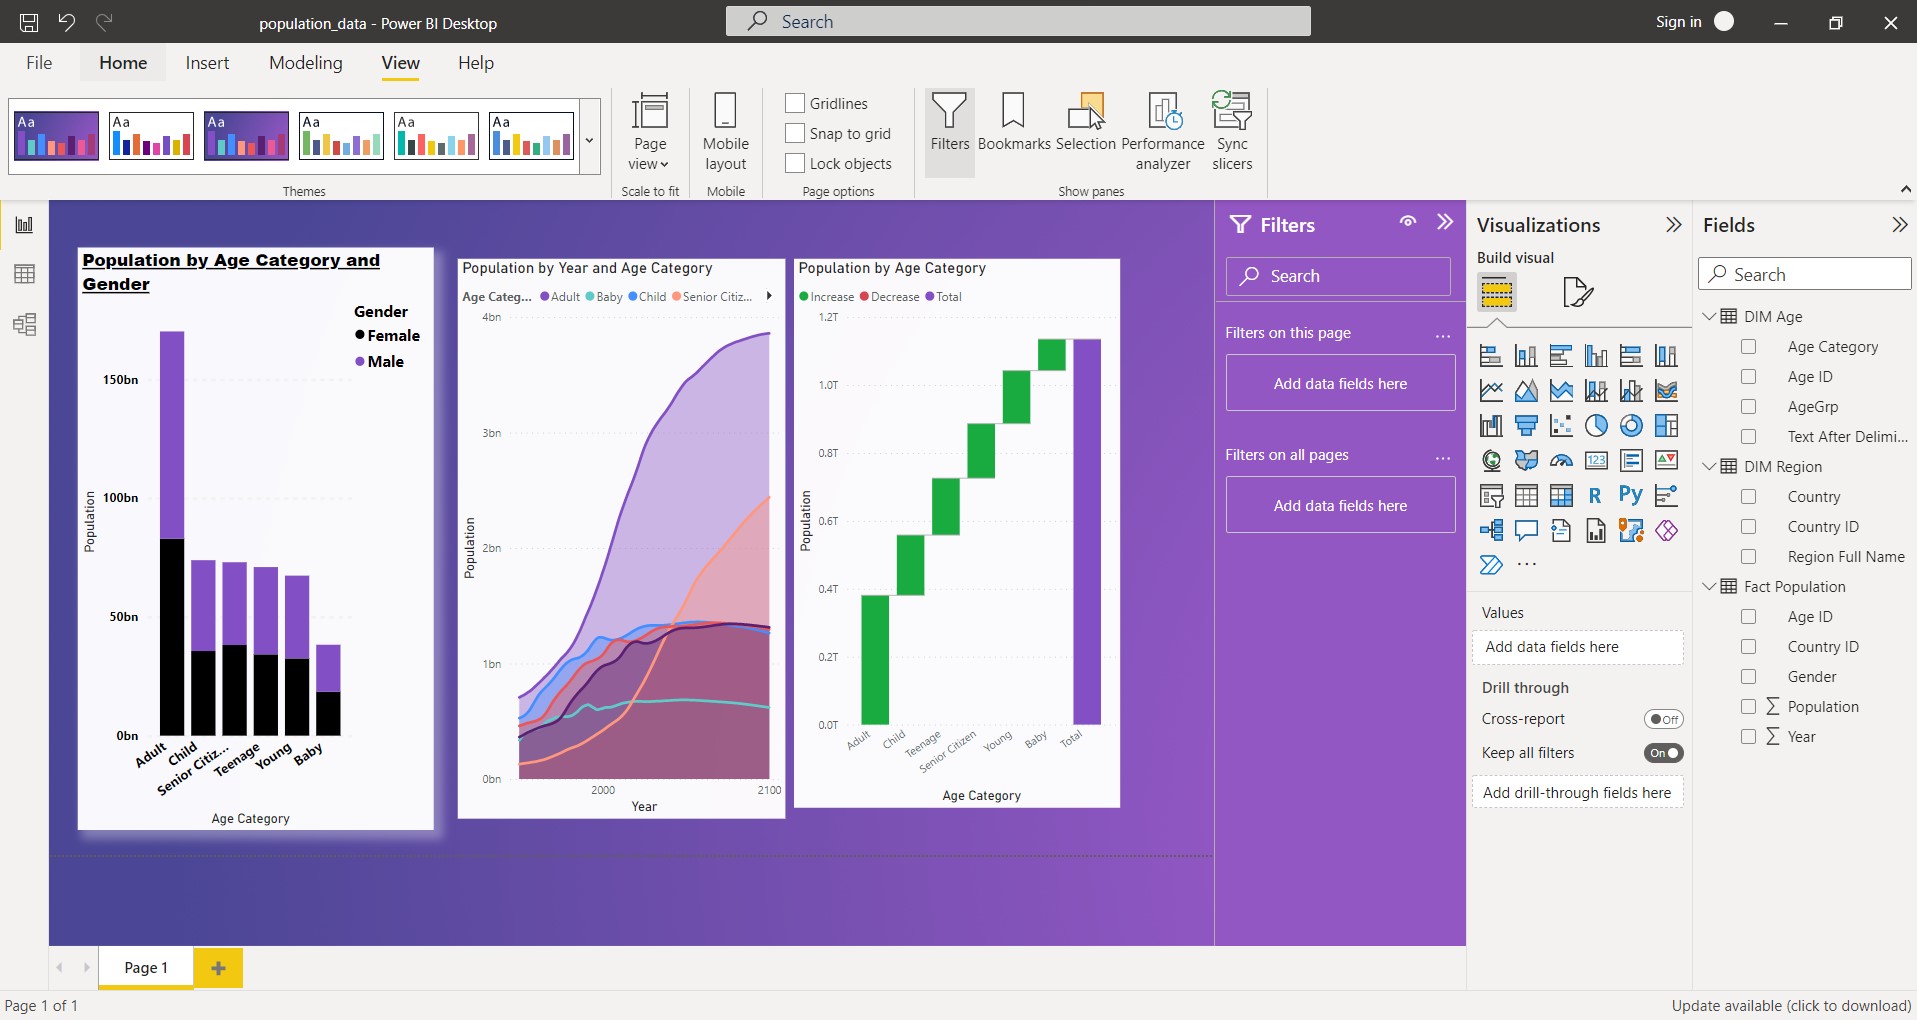
It is present in both Desktops and Services. creating visuals, filtering, themes, background colors, and wallpaper, among other things. Power BI has an inbuilt number of graphs, and you can also customize your graphs and add it to the visualization area.
 Collaboration and Sharing:
It is part of Power BI services. More than one person can work on the same data or project with collaboration and share results across the organization or between themselves.

Understanding Workflow of Power BI
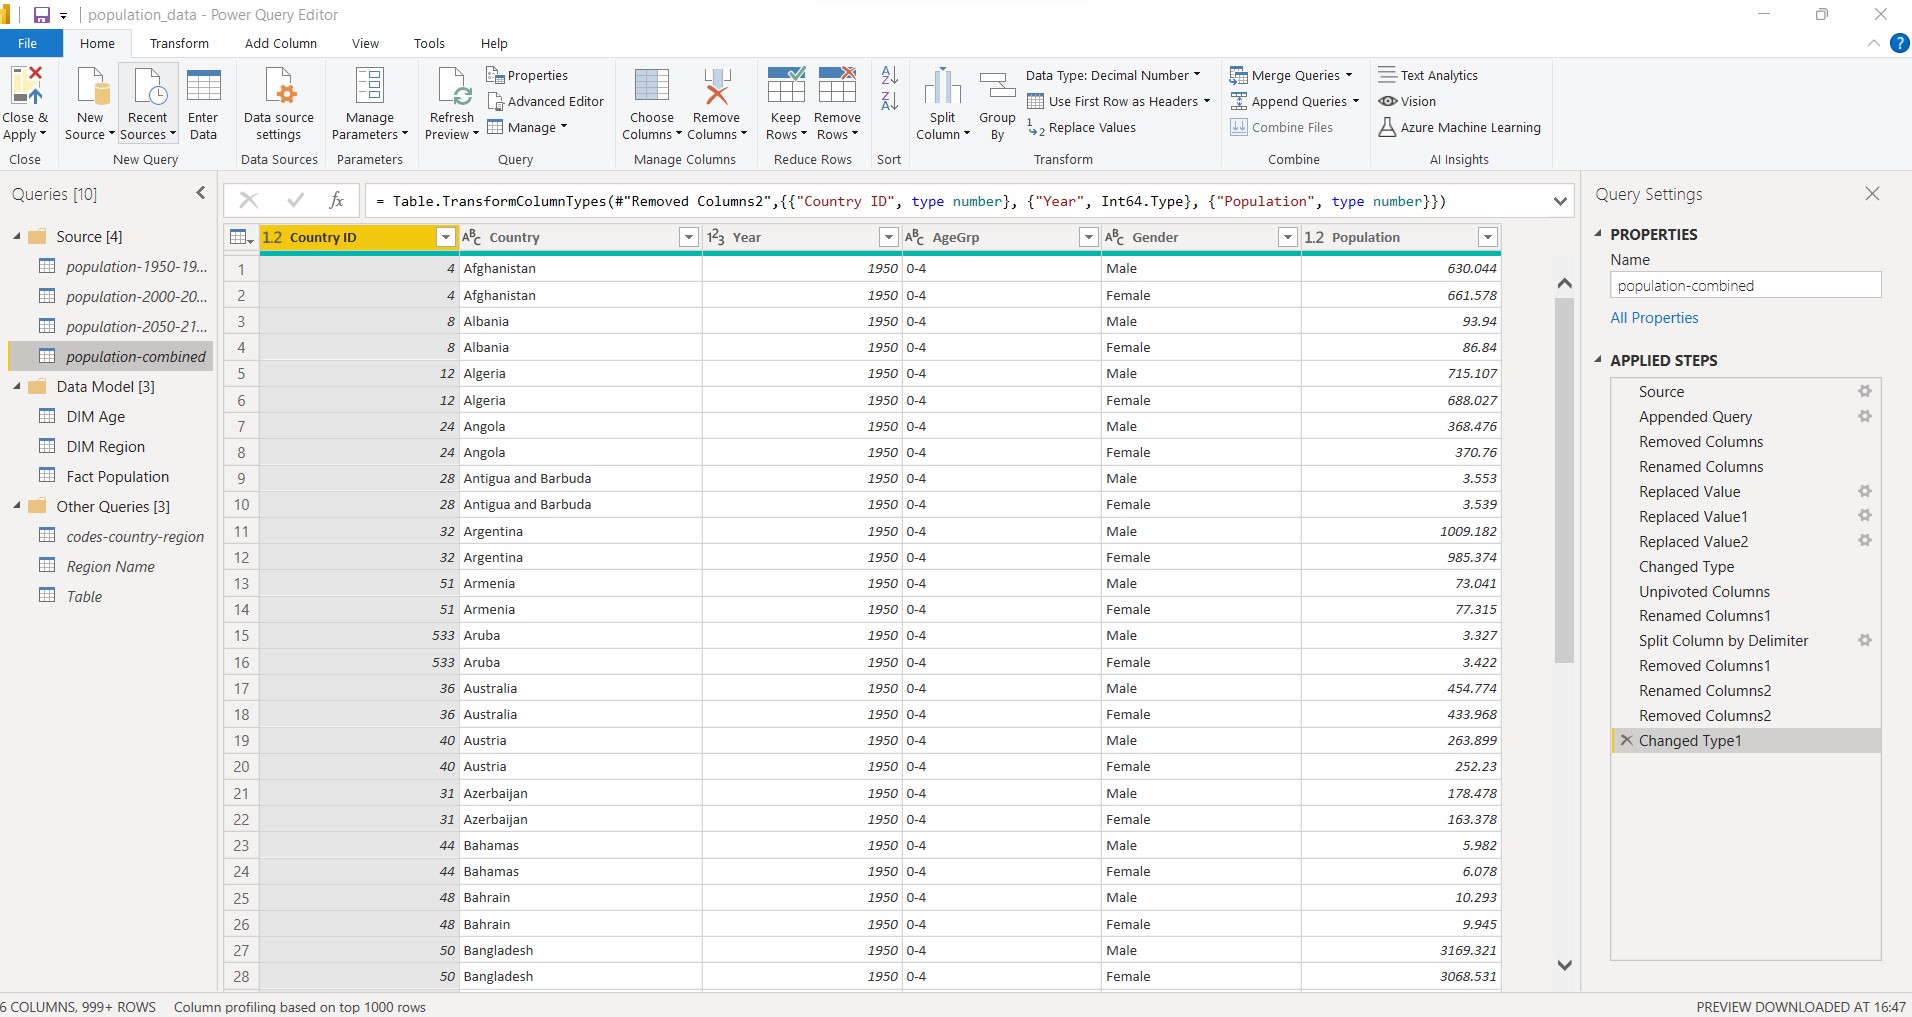
It starts with creating a project or model in Power BI Desktop and connecting the project with the source file, which contains raw data, i.e. data that contains numerous errors and a great deal of information. The Power Query Editor is the first place we should transform raw data to. As its name suggests, this is where we can execute all the data editing options necessary to meet the needs of our project. Before applying the data to the project or Data Model, you perform all data cleaning, formatting, and shaping in Query Editor. In data cleaning and shaping, you deal with rows, columns, error handling, etc. Therefore, you can use the query editor to perform all data preparation, or one could say pre-processing, before applying the data to the data model.
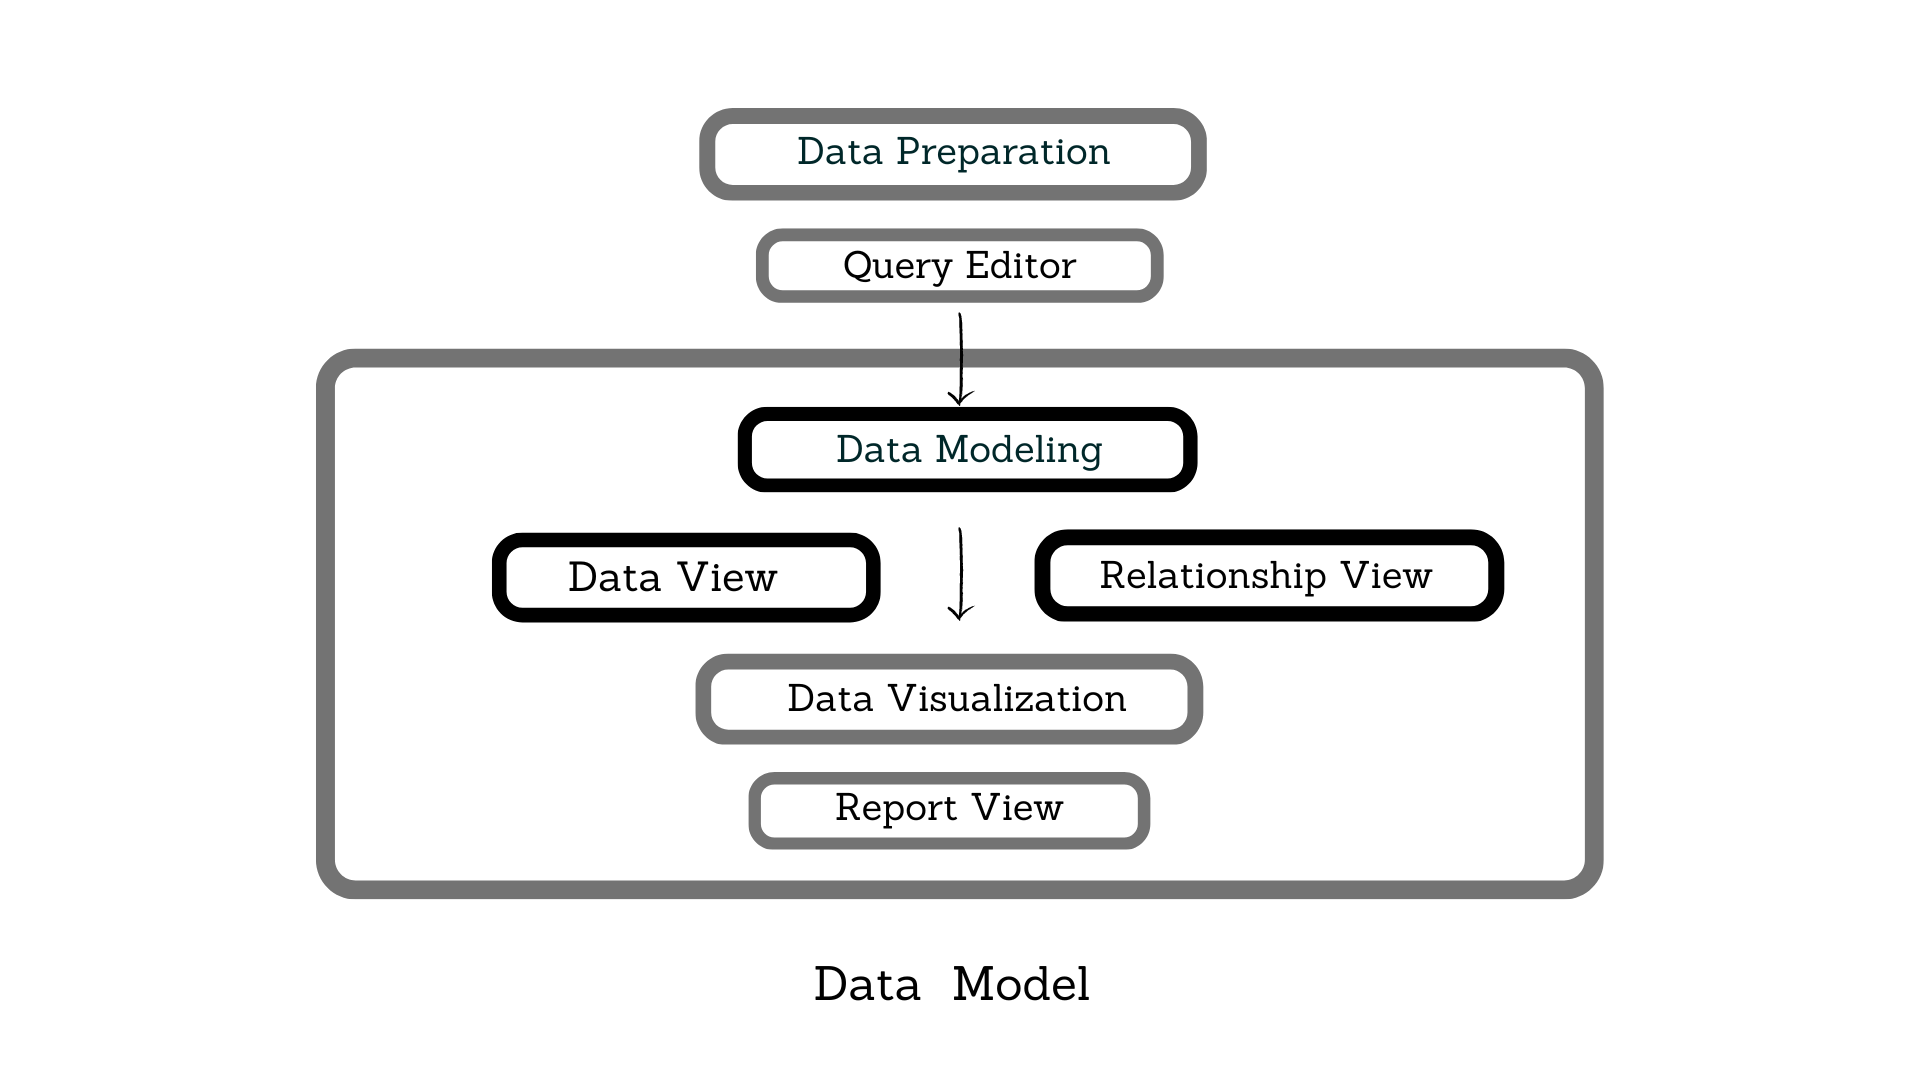
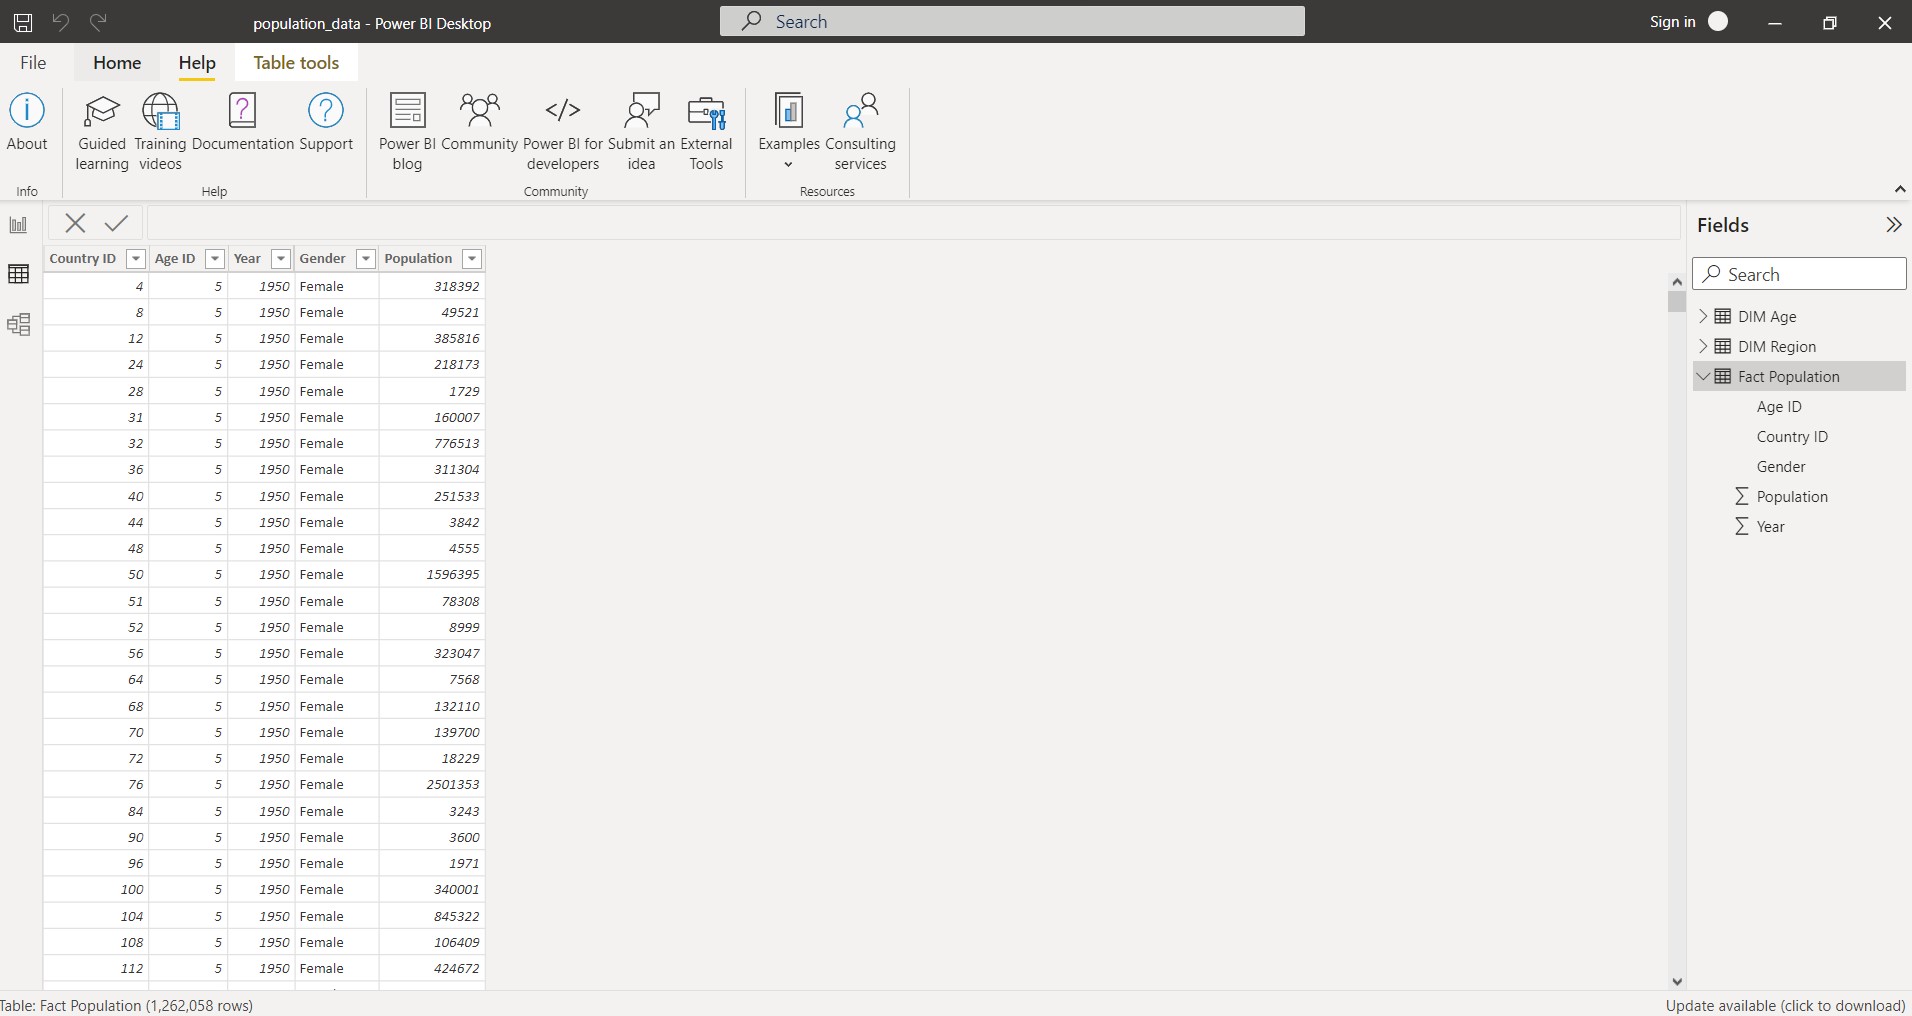 After applying data from the Query Editor, data is applied to the Data Model. In Data Model, you can create impactful visuals and graphs, prepare reports and make relationships from data. Data Model is provided with numerous services like Data view, Relationship view, number of inbuilt visuals, filtering option, and many more. You can perform several operations here also in Data Model. One can view and analyze data in the Data view, and you can create relationships between various data sets in the Relationship view. Data Visualisation is the core part of Power BI. In visualization, you can create various types of graphs like line charts, stack bar charts, tree maps, slicers, pie charts, and so on, to view data. In addition, you can perform several operations on visuals like themes, wallpaper, and background color and make graphs more attractive and impactful. If your preferred graphics are unavailable, you can still add custom visuals to Power BI with the aid of Node.js.
Finally, in Data Model, you can view your final reports, including graphs, data files, etc. And you can either export it to a local system or publish it to the cloud i.e. Power BI Services (Pro).
After applying data from the Query Editor, data is applied to the Data Model. In Data Model, you can create impactful visuals and graphs, prepare reports and make relationships from data. Data Model is provided with numerous services like Data view, Relationship view, number of inbuilt visuals, filtering option, and many more. You can perform several operations here also in Data Model. One can view and analyze data in the Data view, and you can create relationships between various data sets in the Relationship view. Data Visualisation is the core part of Power BI. In visualization, you can create various types of graphs like line charts, stack bar charts, tree maps, slicers, pie charts, and so on, to view data. In addition, you can perform several operations on visuals like themes, wallpaper, and background color and make graphs more attractive and impactful. If your preferred graphics are unavailable, you can still add custom visuals to Power BI with the aid of Node.js.
Finally, in Data Model, you can view your final reports, including graphs, data files, etc. And you can either export it to a local system or publish it to the cloud i.e. Power BI Services (Pro).
Query Editor vs Data Model
Power BI Services (Pro)
Power BI Services is a Cloud-based service provided in Power BI. It consists of a set of software and applications, which provides business analytics solutions that offer business analytics solutions, enabling you to quickly and effectively analyze and visualize your data.
In Power BI Services, we can prepare reports and visualize the data as you do at Power BI Desktop. But note that this is not the place to do the data preparation phase. Data Preparation steps such as data cleaning, shaping, formatting, replacing errors, error handling, pivot-unpivot, splitting, and dealing with rows and columns can be done only at the Desktop before you can publish the finished data to the cloud and carry out the next steps there as well. In addition, Power BI Pro offers Collaboration and Sharing, allowing you to work collaboratively with others and share results with them. Power BI Desktop lacks these collaboration and sharing features; there, you work alone in a local system.
Four Important sections of Power BI Services
1. Workspace:
It is one of the key locations in Power BI Pro. It consists of dashboards, reports, datasets, workflow, etc in Power.
There are two types of workspace in Power BI:-
• My Workspace:This is the personal place where you alone work on reports, datasets, dashboards, etc, and no one else can access your workspace.
• Workspaces: This is where you collaborate with others on datasets, reports, and dashboards with collaboration and share information across the team.
2. Dataset:
It is a place where a collection of data is kept. Each data set is imported, brought to this location, and connected to Power BI.
3. Report:
Report is the place where you create visuals and graphs. It consists of reports with one or more pages that include several different visuals.
4. Dashboard:
It is single-page information that reflects the whole crux of the project in the form of visuals and reports. As it is limited to a single page, only the most important details of the entire story are shown. It is also known as Canvas.
Power BI Mobile
Power BI Pro is an End-User-Application using which you can create a mobile application that can be downloaded on mobile. Power BI Mobile provides a set of applications for Android and IoS. With the Power BI Mobile application, you can access your project from anywhere. You can see reports, visuals, dashboards, datasets, etc., from the application. But one cannot edit datasets or data models on the Power BI Mobile application. It provides the feature that allows us to share information with others and data alert and annotation features.
One Tool - Two Languages
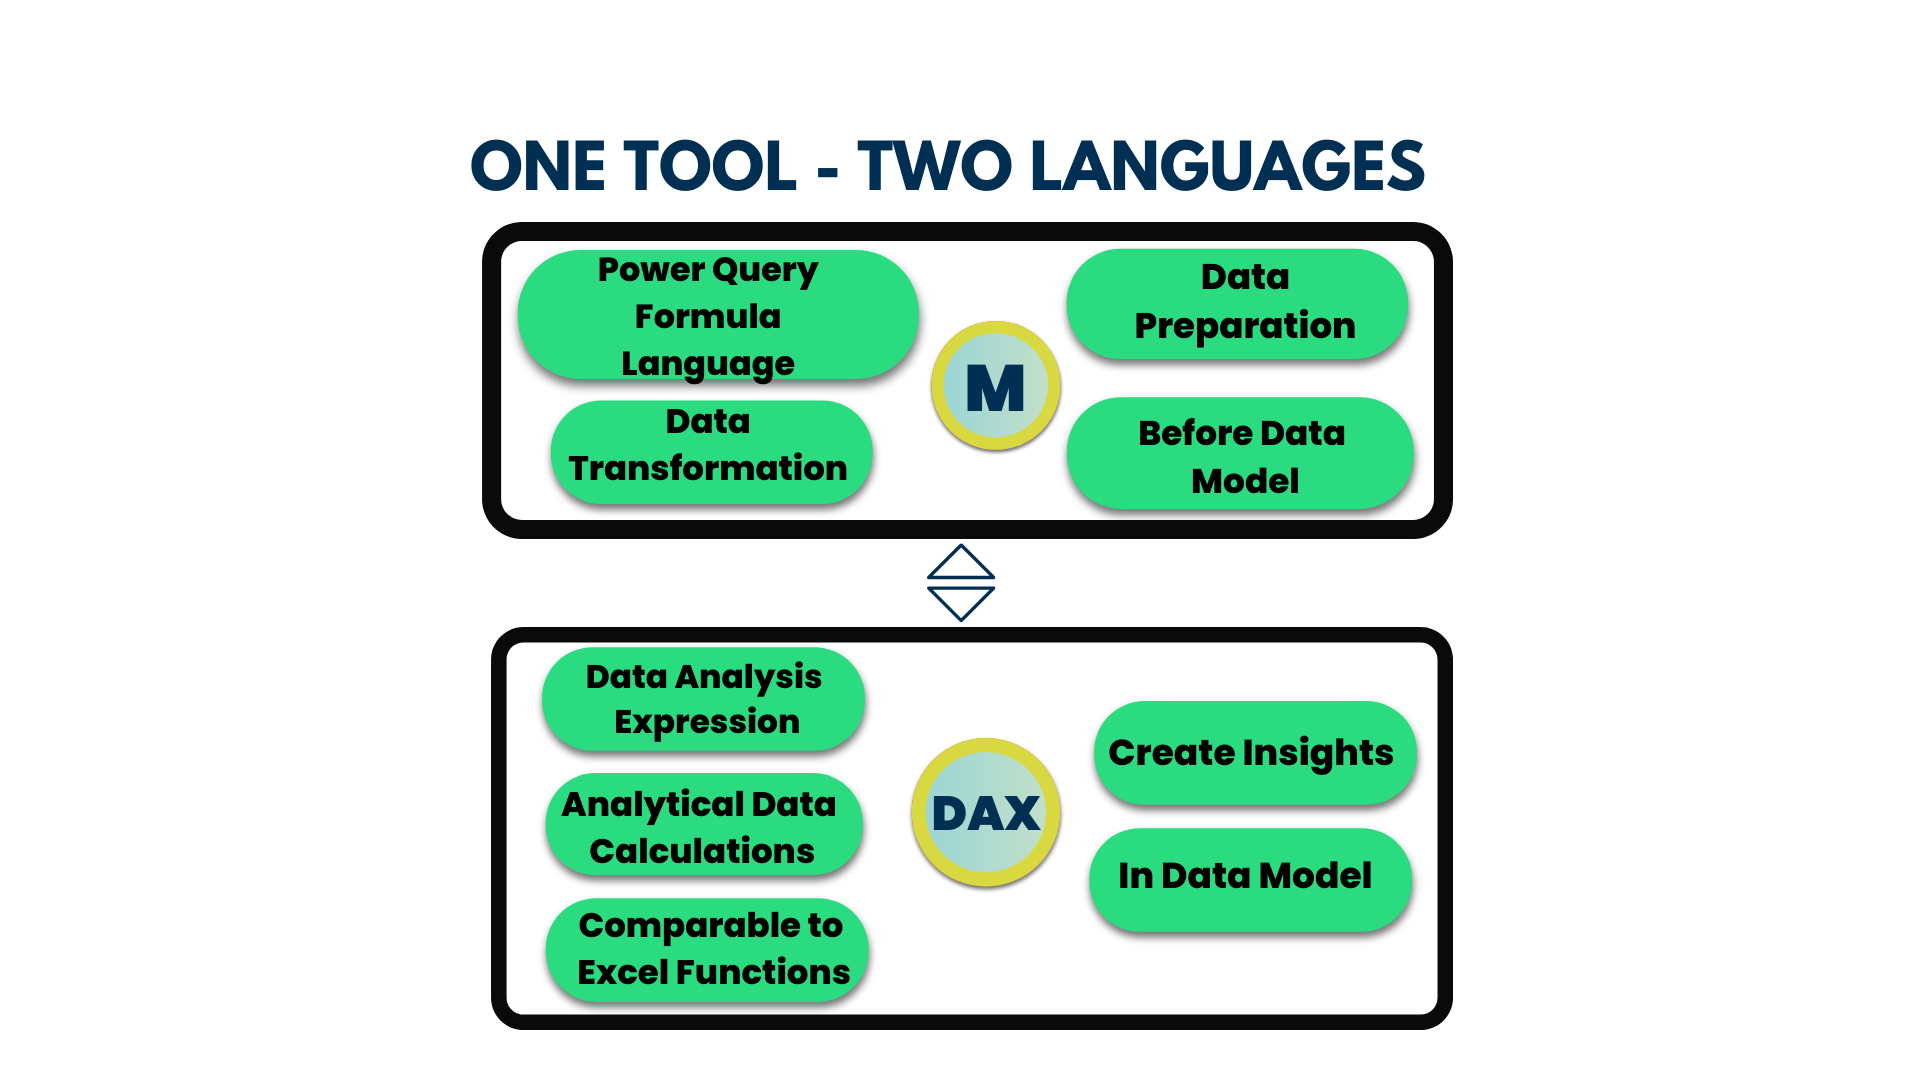
M-Language -
M stands for Mashup. M-language is the dialect that the Power Query Editor uses. When it comes to data preparation, cleaning, formatting, and shaping, Query Editor is the crucial element of Power BI. the M-Language operates on the Query Editor's backend. M-language controls all the steps you do at the interface of Query Editor.
DAX Language-
DAX Stands for Data Analysis Expression. DAX is the language that is used in Data Model. Data visuals, graphs, preparing reports, making relationships, etc., are all performed in Data Model. The DAX language is used to perform every action you take on the Data Model's interface.
DAX and M-language are not dependent on each other.
KNOW MORE ABOUT
IS POWER BI SO IMPORTANT?
Power BI is the combination of Business Intelligence and Business Analytics. It converts any raw data- structured or unstructured data into simple reports and impactful visuals by getting insights into data. And it takes your decision-making skills to next level. It is a powerful tool for the organization that deals with Data analysis, Data Pre-Processing, and Data Science.
IS POWER BI A HOT DEMANDING TOOL IN THE MARKET?
Among all tools, Power BI is the most powerful one in Business Analytics and Data Analytics. If you go through the current scenario in the market, Power BI emerged as a revolutionary tool in the analytics field, and also analytics become an inseparable part of the market. Power BI is a highly flexible and versatile tool. It is highly demanding in companies today. Moreover, most MNC and big firms are searching for Power BI certified professionals. Apart from this, Power BI plays a vitally important role -in the Data Science field for the analysis of data.

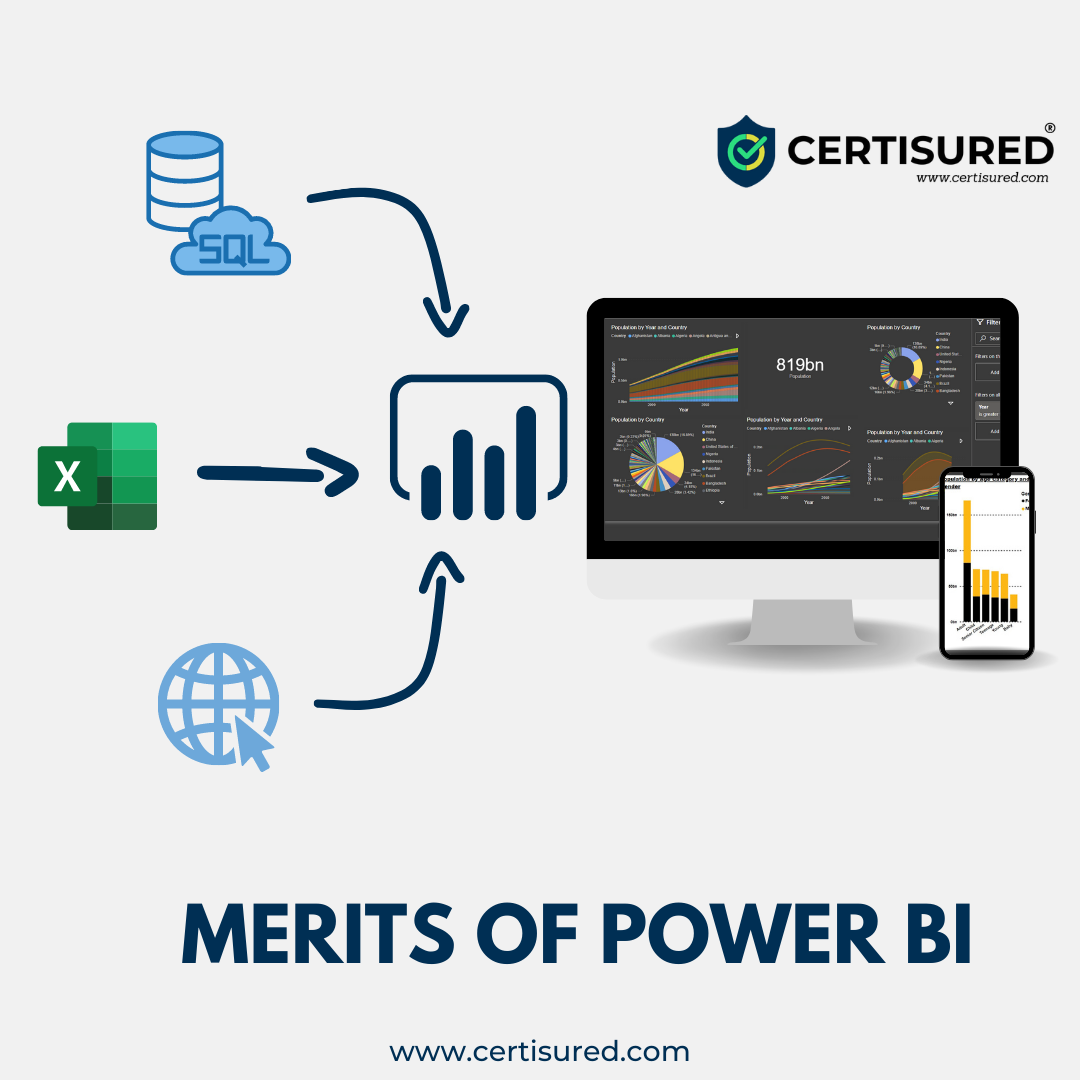
MERITS OF USING POWER BI
Power BI is a top Business Intelligence tool because it contains a variety of business information and data analysis features. Here are some of the most important advantages of the Power BI tool:
- Easy-to-use
- Interactive visual dashboards
- Multiple source connectors
- Advanced data services
- Easily accessible from anywhere
SCOPE OF POWER BI
Data is crucial to digital innovation, which is increasingly being embraced by practically all sectors. Data skills are highly sought after as the fourth industrial revolution is driven by data. Because so much data is produced every day, it is essential to evaluate it and use the results to make informed decisions. Power BI has established itself to be the favorite tool of the corporate community and isn't likely to lose popularity anytime soon because of its superior cloud-based data visualization capabilities. As businesses are gradually moving away from on-premise work environments toward cloud platforms, Power BI has a lot of potential in the future because it is a cloud-based solution.
AVERAGE SALARIES FOR DIFFERENT JOB ROLES
Power BI experts take home a large monthly salary. The average pay of Power BI professionals with various profiles is shown in the following chart.

TOP RECRUITERS OF POWER BI IN INDIA
Since its launch, Power BI has been utilized by several businesses and organizations around the globe. Some of the top employers of Power BI specialists in India are given below.
-
Big Four Audit Companies: EY, KPMG, PWC, Deloitte.
-
Dell Computers.
-
Hexaware Technologies
-
Capgemini
-
HCL Technologies
-
Infosys Limited
-
Wipro Technologies
-
Microsoft Solutions
about the author
Vikas Johal
Vikas Johal is Junior Data Scientist and Power BI Instructor at Analogica, Bangalore. Presently exploring the vast field of Data Science and Business Intelligence.
