Python
Logistic Regression


Logistic Regression
There are many popular machine learning algorithms, one among them is Logistic Regression. Logistic regression is a model which is used in classification and predictive analytics. This regression comes under supervised learning.
What is Supervised Learning?
Supervised learning is a type of machine learning, that uses labeled datasets to train algorithms to classify and predict the result.
This type can be used in classification and regression-type problems-
- Classification Algorithm - SVM (Support Vector Machine), KNN (K-nearest neighbor), Decision Tree, Random Forest.
- Regression Algorithms – Linear Regression, Logistical Regression, and Polynomial Regression are a few popular algorithms.
Regression is the technique used to determine the relationship between a dependent and an independent variable. This relationship is used to fit the corresponding line to the independent variable and predict the dependent variable value.
Example: Predicting the future price of the stock from the previous year's data.
Logistic regression is used when the value of the dependent variable is categorical, which means they have binary outputs like ‘0’ and ‘1’ or ‘true’ and ‘false’ or ‘yes’ or ‘no’. This regression is basically used to solve binary classification problems like spam detection as the output to predict is simple spam or not spam.
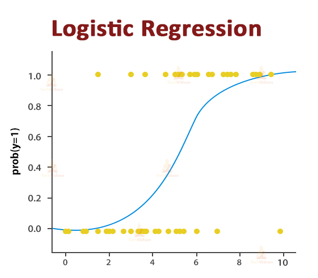
The logistic function is also known as the sigmoid function. The sigmoid function maps any real value within a range of 0 to 1. The curve formed is in the shape of the English alphabet ‘S’. Here we use the concept of threshold, which tells us the probability of either 0 or 1. The values below the threshold tend to be 0 and the above value tends to be 1.
Representation of logistic regression:
Odds = p/(1-p) = probability of event occurrence/probability of not event occurrence
ln (Odds) = ln(p/(1-p)) = here, p is the probability of occurrence of an event.
This method requires a large sample size to draw a conclusion.
Advantages Some of the advantages of this algorithm are
- Simplicity: This algorithm is simple and easy to implement
- Handles Categorical and continuous values: It can handle both types of values, that is numbers and also in yes and no format.
- Robustness: The outliers and noise do not affect the performance of the algorithm.
Disadvantages
- Limited to linear relationships: The algorithm performs well only for linear relationships and is very effective for non-linear relationships.
- Sample size: It requires a large sample size to predict accurate results.
- Vulnerability to Overfitting: If the number of independent variables is large compared to the number of observations, logistic regression can be prone to overfitting. Overfitting occurs when the model fits training data too closely(it may even consider outliers) and does not perform well on new or unseen data.
Applications
- Email spam classifier
- Credit card fraud detection
- Disease Diagnosis
Implementation of Logistic Regression using Python Let us consider a dataset that consists of data related to heart disease in humans. Now let us build a model which predicts the result and accuracy of the model.
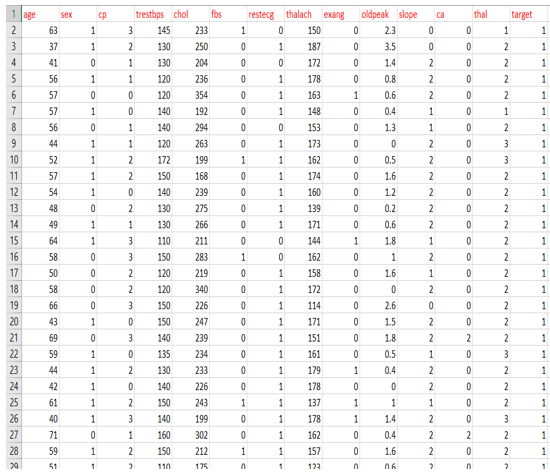
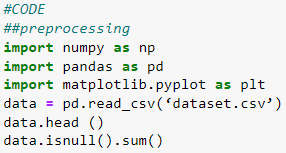
1. Data Preprocessing (Importing the necessary libraries and dataset):
Data preprocessing is an important step where we import the necessary libraries required for our model, acquire our dataset, and identify missing values.
-
The Numpy library is used to deal with arrays.
-
Pandas is used for data analysis and it is built on numpy library.
-
Matplotlib library is used for data visualization like bar graphs.
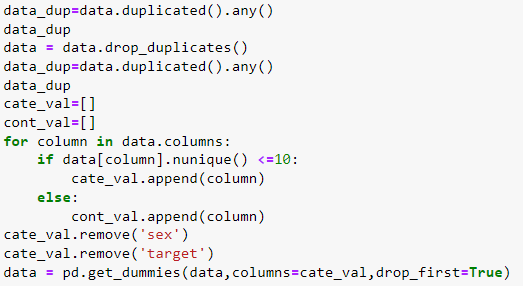
2. Removing duplicate values:
The dataset is checked for any duplicate values and if duplicate values are present, we can delete them. We delete duplicate values as they can ruin the split between train, validation, and test data which is the next step.
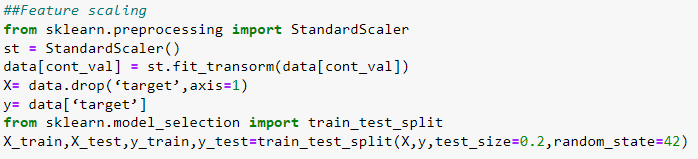
3. Feature scaling
Here we basically normalize the range of independent variables (that is in the range of 0 to 1 for our logistic regression). This is done because we want to get accurate results of predictions. We also split the dataset into categories- Train and Test. In this Python code, we have set the train data as 80% and test data as 20% from the above dataset.
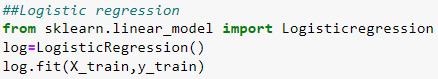
4. Train the Model:
Once the dataset is split into the train, test, and validation sets, we will be fitting the model to the training set, we will import LogisticRegression class from sklearn library.
5. Prediction:
After the completion of training, the last step is the prediction step. We import the accuracy class from sklearn.metrics to calculate the accuracy of the predicted output. Here the result is predicted and accuracy is checked. If the predicted result is correct and efficiency is high, then the model is good and can be used on new or unseen datasets.
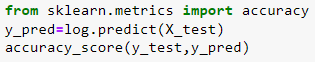
If we run the above code, it gives us the accuracy score of the model.
Conclusion
This model is an analysis technique that helps predict the probability of an event. By understanding the key components and workings of logistic regression, data scientists and analysts can leverage its power to make accurate predictions and informed decisions.
about the author
KIRAN S RAJU
Kiran is currently pursuing final year B.E in Information Science and Engineering.
