Machine Learning
Cluster Crafting


Imagine a big library trying to organize its books. Each book represents a person, and the goal is to group similar people together based on their interests. However, the challenge is figuring out how many groups (clusters) make sense. If we make too few groups, like just one or two, it's like putting all the books in just a couple of sections - it's too broad, and we might miss out on organising them in a meaningful way.
On the other hand, if we make too many groups, like a hundred, it becomes overwhelming and confusing. So, the library staff needs to find the right number of groups, like picking the right number of book categories, to make it easy for people to find what they're looking for. This is similar to finding the optimal number of clusters (K) in real-life situations, ensuring that things are organized in a way that makes sense and is useful. The librarians, just like data scientists, face an important question: How many different groups, or clusters, should they make to understand all the different interests?
Clustering
Clustering is a type of unsupervised learning, where we analyse datasets without labeled responses. This method helps identify meaningful patterns, underlying processes etc. The method of dividing the objects into clusters which are similar between them and are dissimilar to the objects belonging to another cluster. K-means clustering is a widely favoured method in clustering for several reasons like efficiency, simplicity, and versatility. “K-Means is a clustering algorithm whose main goal is to group similar elements or data points into a cluster.
Note: ”K” in K-Means represents the number of clusters

Methods to Find the Best Value of K
In this blog, we will discuss the most important parameter, i.e., the ways by which we can select an optimal number of clusters (K). There are methods to find the best value of K. We will discuss them individually.
1.Elbow Method:
The elbow method is a technique used in K-means clustering to find the optimal number of clusters (K) for a given dataset. The basic idea is to run the K-means algorithm for a range of K values and plot the within-cluster sum of squares (WCSS) ,WCSS is the sum of the squared distance between each point and the centroid in a cluster. against the number of clusters.
When we plot a graph of Within-Cluster Sum of Squares (WCSS) against the number of clusters K . The graph looks like a bent arm. At first, as we increase the number of clusters, the WCSS goes down. The WCSS is the highest when we have only one cluster . If we look closely at the graph, there's a point where it noticeably changes shape, creating a bend like an elbow. After this point, the graph moves kind of straight along the bottom. The number of clusters we see at this elbow point is the best choice for getting meaningful clusters from our data.

Advantages of the Elbow Method:
1.Easy to understand and implement by seeing the plot and look the “elbow point”.
2.When clusters are clearly defined elbow method is visible
3.There is no need of calculating within-cluster sum of squares (WCSS) ,we can use built in support for calculation
Disadvantages of the Elbow Method:
1.The elbow may not appear clearly when clusters are not well – separated.
2.Most effective with algorithms like K- means but not suitable for all clustering approaches.
3.A low WCSS doesn’t mean good clustering – it might just reflect increasing model complexity.
The curve looks like an elbow. In the above plot, the elbow is at k=3 (i.e., the Sum of squared distances falls suddenly), indicating the optimal k for this dataset is 3.
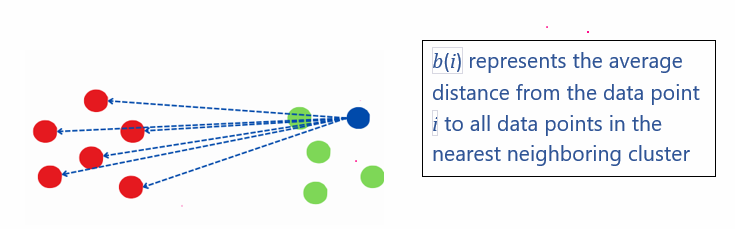
2. Silhouette Analysis The Silhouette Method is a technique used to assess the quality of clusters in a dataset. It provides a way to measure how well-separated and distinct the clusters are, helping to determine the optimal number of clusters (K) in clustering algorithms. Step involved in calculation silhouette scores are: Step1: Select Range of values K Step2:Calculate Silhouette Score for every k Assume the data have been clustered via any technique, such as K-Means into k clusters The equation for calculating the silhouette Score for a each data point:


 Step 3: Plot the silhouette scores
You can visualize the silhouette scores by plotting them against their respective K values. This graphical representation aids in identifying the juncture where the silhouette scores begin to stabilize.
Considerations When Calculating Silhouette Coefficient:
The value of the silhouette coefficient is between [-1, 1].
Positive scores indicate that points within clusters are well-matched, while negative scores suggest potential misplacements.
An average silhouette width above 0.7 is considered strong, 0.5 is considered reasonable, and 0.25 is considered weak.
Step 3: Plot the silhouette scores
You can visualize the silhouette scores by plotting them against their respective K values. This graphical representation aids in identifying the juncture where the silhouette scores begin to stabilize.
Considerations When Calculating Silhouette Coefficient:
The value of the silhouette coefficient is between [-1, 1].
Positive scores indicate that points within clusters are well-matched, while negative scores suggest potential misplacements.
An average silhouette width above 0.7 is considered strong, 0.5 is considered reasonable, and 0.25 is considered weak.
Observing the analysis, we find that the silhouette score reaches its maximum at k = 3. Therefore, we opt for 3 clusters.
Advantages of the Silhouette Method:
1.Provides a numerical score between -1 and 1 , allowing for qualitative comparison between different values of k.
2.A higher silhouette score indicates well-separated , dense clusters , which is easy to understand and compare
3.Can be applied with various clustering techniques eg: k-means,DBSCAN
Disadvantages of the Silhouette Method:
1.Requires distance calculations between all pairs of points and cluster centroids – expensive for a large dataset.
2.The outcome may change significantly depending on whether Euclidean, Manhattan or other metrics are used.
Conclusion
In conclusion, employing the elbow method revealed that utilizing 3 clusters is optimal for our dataset. To further validate this choice, the silhouette method confirmed that a configuration with 3 clusters is suitable. This comprehensive approach involving both the elbow and silhouette methods provides a robust strategy for determining the optimal number of clusters in clustering algorithms, showcasing its effectiveness in cluster analysis.
about the author
Ankitha
Ankitha R completed her undergraduate degree at Bangalore Central University. Throughout her studies, she developed a strong desire to keep up with the latest advancements in Data Science. She was determined to become knowledgeable in Machine Learning and Artificial Intelligence(ML&AI) and build a rewarding career in this field.
