Pandas
"Unleashing the Power of Pandas: A Beginner's Journey into Data Manipulation"


Pandas

In this Blog, I will be writing about all the basic information that you need to know about Pandas such as what is Pandas, why we use them, The applications of Pandas, and Getting started with Pandas, etc.
What is Pandas?
Pandas is a popular open-source Python library for data manipulation and analysis. It provides data structures for efficiently storing and manipulating large and complex datasets, as well as functions for performing common data manipulation tasks such as filtering, grouping, and joining.
Why do we use Pandas?
Pandas is a popular Python library for data analysis and manipulation, offering flexible tools for handling different data formats, cleaning, filtering, transforming, and visualizing data. It is essential for efficient data analysis in Python.
The applications of pandas
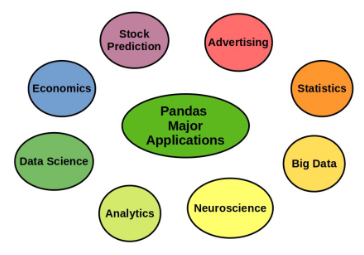
Pandas is a versatile and find applications in various domains. It can be used for financial analysis, scientific research, business analytics, social media analysis, web analytics, and machine learning tasks. With its data manipulation capabilities, Pandas proves valuable for analyzing and processing data in different fields, including finance, research, business, social media, web, and machine learning.
Getting started with Pandas
Setup and Installation Before we move on with code for understanding the features of Pandas,let’s get Pandas installed in your system
Install Pandas
pip install pandas
Jupyter Notebook
pip install jupyter
Jupyter Notebook is an open-source web application for creating and sharing documents with live code, equations, visualizations, and text. It's popular among data scientists, researchers, and educators for interactive data analysis and collaboration. The notebook format enables easy organization and sharing of code and results, promoting reproducible research
Sample Data
Here I am using a iris dataset, It comprises of each petal and sepal length and their width and also with their species.
Load data with Pandas
Loading data with pandas involves reading data from different file formats such as CSV, Excel, SQL, and more. Pandas provide various functions to load data from these file formats, such as read_csv(), read_excel(), read_sql(), and others. Once the data is loaded into a pandas DataFrame, it can be manipulated, cleaned, and analyzed using various pandas functions and methods.
From CSV File
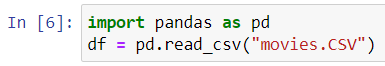
You can load data by giving the CSV file name in the pd.read_csv()function.

You can load data by giving its file path also.
Understanding Data
Now that we have the DataFrame ready let’s go through it and understand what’s inside it.
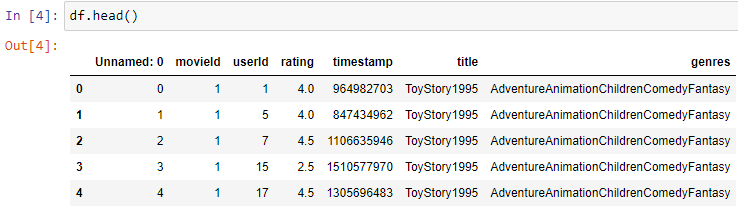
- To show you a gist of data use
- df.head()
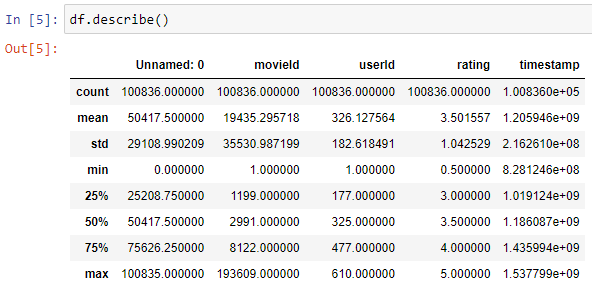
- To show the statistical value of data use
- df.describe()
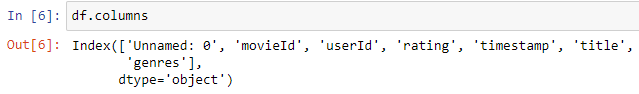
- To show the columns in the data use
- df.columns
Pick & Choose your Data
Now that we have loaded our data and understood its structure. let's pick and choose and perform operations on the data.
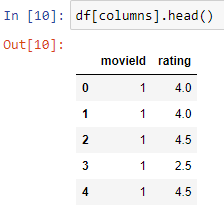
Selecting Columns
- Create a list of columns to be selected

- Use it as an index to the DataFrame
- Using the loc method
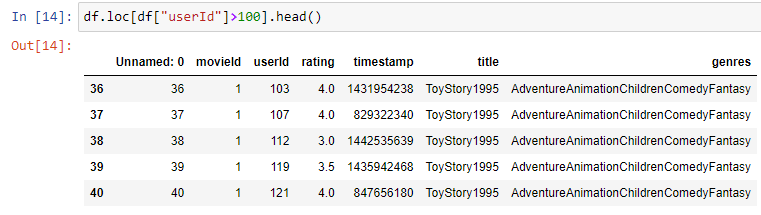
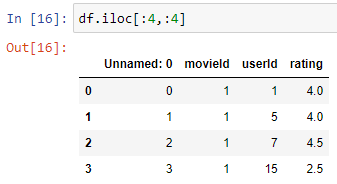
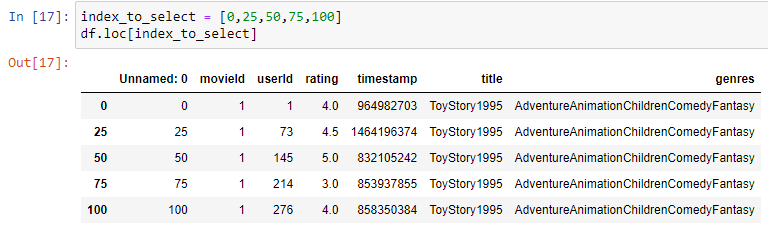
Selecting Rows
Selecting rows is the process of filtering a Pandas DataFrame to only include rows that meet certain criteria.
- using numerical indexes - iloc
- using labels as index-loc
How to handle Missing values in pandas

Handling missing data is an essential part of working with data, and Pandas provides several methods for dealing with missing data in DataFrames. In this article, we will discuss some of the common methods for handling missing data in Pandas.
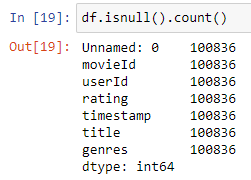
Identify missing data
The first step in handling missing data is to identify where it exists in the DataFrame. We can use the isnull() function to check for missing data, which will return a Boolean value indicating whether each element in the DataFrame is null or not.
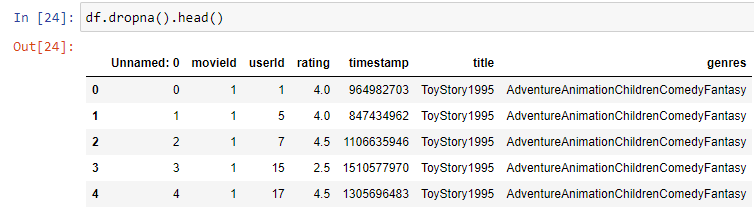
Remove missing data
One option for handling missing data is to simply remove it from the DataFrame. We can use the dropna() function to remove any rows or columns that contain missing data. This can be useful when the missing data is in a small percentage of the DataFrame and removing it will not significantly affect the analysis.
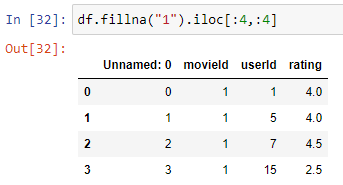
Fill missing data
Another option for handling missing data is to fill it in with an appropriate value. We can use the fillna() function to fill in missing data with a specified value or method. For example, we can fill in missing data with the mean or median value of the column, or with a value from a previous or subsequent row.
Data cleaning and transformation techniques using Pandas

Data cleaning and transformation are critical steps in the data analysis process, and Pandas provides a variety of functions and methods for performing these tasks
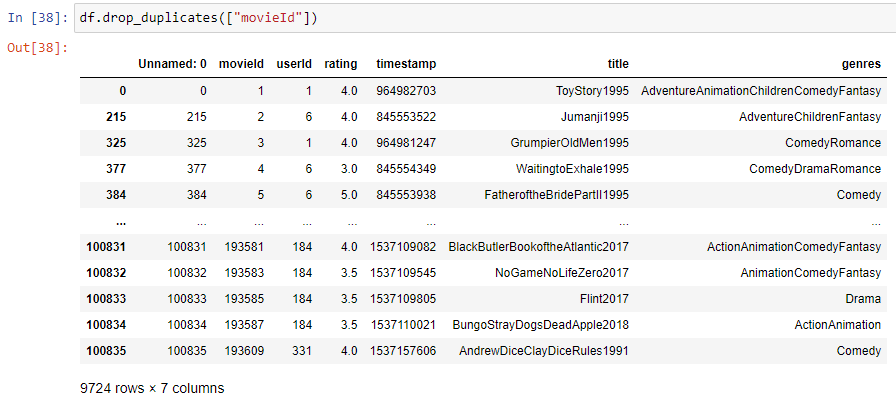
Removing Duplicates
Pandas provides the drop_duplicates() method to remove duplicate rows from a dataframe. By default, this method removes duplicates based on all columns, but you can also specify a subset of columns to consider.
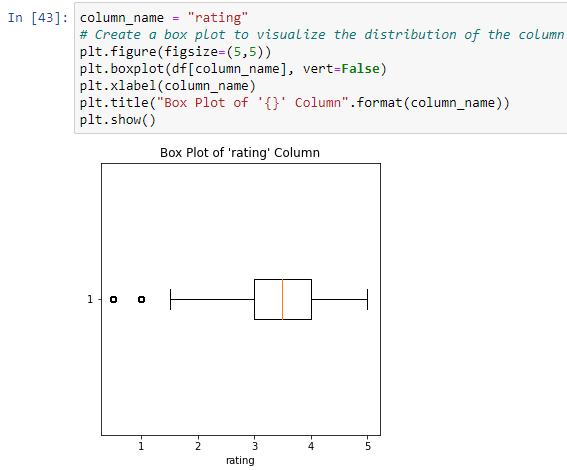
Handling Outliers
Handling outliers in Pandas involves identifying and removing the data points that are significantly different from other observations in the dataset. Outliers can be caused by measurement errors, data entry errors, or other factors, and can have a significant impact on statistical analysis and machine learning models.
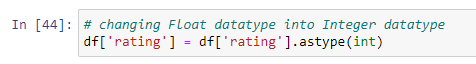
Changing Data Types
Pandas provides the astype() method to change the data type of one or more columns in a dataframe. You can specify the new data type as a string, or use one of the numpy data types.
Filtering Data Pandas provides several methods for filtering data, including query(), loc[], and iloc[]. These methods allow you to select rows or columns based on specified criteria.
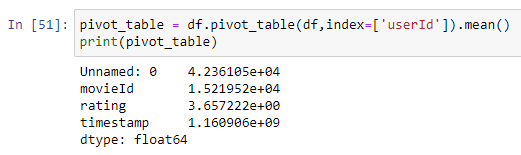
Pivot Tables Pandas provides the pivot_table() method to create a pivot table from a dataframe. This method allows you to group data based on one or more columns, and then calculate summary statistics for each group.
The Benefits of Data Cleaning
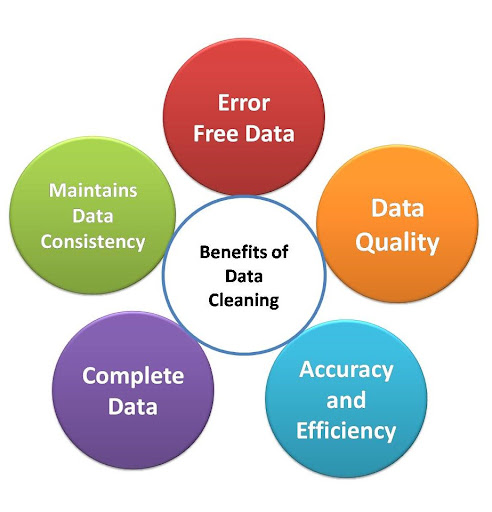
Data cleaning is essential for improving data quality. It involves identifying and correcting errors, ensuring data consistency, and removing redundant or irrelevant information. Data cleaning leads to better analysis, easier integration of data from multiple sources, faster processing, and improved data visualization.
Conclusion
Pandas is a Python library that simplifies data analysis and visualization. It offers various plotting tools, like line plots, bar plots, scatter plots, and pie charts, which can be customized. Handling missing values is easy with dropna() and fillna() functions. Pandas also helps with data cleaning and transformation tasks, such as removing duplicates, replacing values, renaming columns, and converting data types.
about the author
Pruthvi Raj R
Pruthvi Raj is studying Computer Science in Diploma at SJP Govt Polytechnic
