Data Analytics
CHOOSING X AXIS AND Y AXIS


When we need to plot a graph, we need two variables to establish a relationship on the Coordinate system by correctly selecting the ‘X-Axis and ‘Y-Axis. People often get confused like which variable to be taken on which axis. Let’s go further and dig out and understand with an example.
- The two variables are the independent variable and the dependent variable.
- The ‘X-Axis and ‘Y-Axis are the axes in the Cartesian Coordinate system.
- The ‘X-Axis is a horizontal straight line (Left to Right)
- The ‘Y-Axis is a vertical straight line (Up and Down)
- The independent variable goes on ‘X-Axis and the dependent variable goes on ‘Y-Axis.
- Selecting variables on the correct axis is very much important because if we choose the variables oppositely, the interpretation will go wrong and the relationship cannot be established.
- In simple words, the ‘Y-Axis depends on the ‘X-Axis means that 'X' variable is the cause and ‘Y’ variable is the effect.
Let us understand clearly with an example.
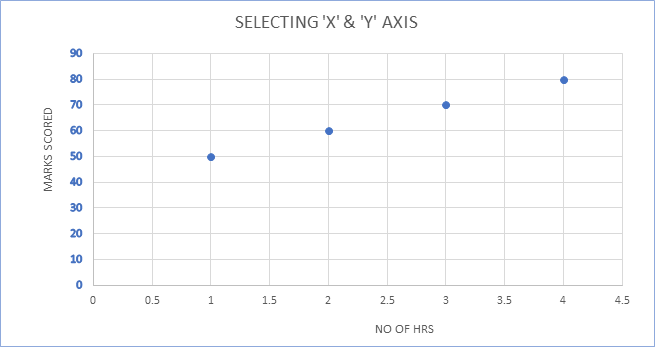
Suppose a teacher collects data on the following variables for students in his class
- No. of hours studied
- Exam marks scored
The above-mentioned variables should be placed on the axes (X, Y) Here we know that if the student studies for more hours, he will score good marks, and if the student studies for fewer hours, he might score fewer marks which in turn means that Exam marks scored will depend on no. of hours studied.
Hence, we can identify the axes as mentioned below:
- No. of hours studied - ‘X-Axis
- Exam marks scored - ‘Y-Axis
Now if we take the same scenario in Data Science, we can represent (put) the above matter as
-
When plotting a graph, it is important to first have clarity about the independent variable and dependent variable.
-
The analyst should seek the appropriate information from the client or stakeholder as to what the Target vector is.
-
When a data set is given, the analyst identifies the target vector and feature vector.
-
The Feature vectors are usually modeled on the ‘X-Axis and the Target vectors are modeled on the ‘Y-Axis.
-
Thereby a relationship will be obtained and the analyst analyzes the given data set.
about the author
Pachipulusu S Mahesh
Mahesh is a passionate, ambitious and highly organized guy. He holds an Engineering degree in Telecommunications. He works for a Nationalized Bank and has vast experience and knowledge in the Banking industry.
