\nLet us look at a simple application of reducing 2D to 1 principal component dimension. Assume 2 different datasets which are defined by 2 dimensions i.e., Feature 1 and Feature 2 as shown below,\n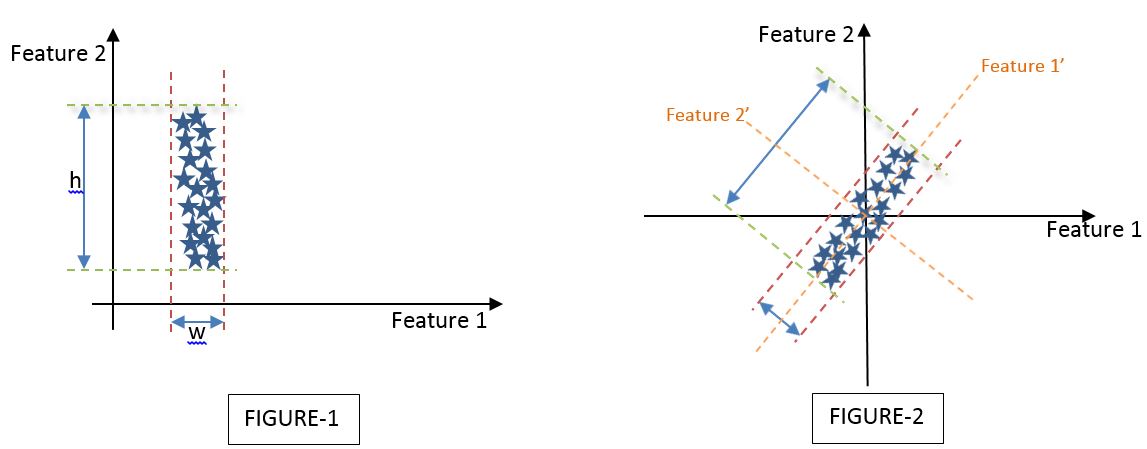\n\nLet me try to interpret both FIGURE-1 and FIGURE-2 individually by conceptualizing the PCA to reduce a 2-dimensional space to a 1-dimensional space.\n\n**Interpretation of FIGURE-1:**
\nWe have assumed a dataset defined by Feature 1 and Feature 2 such that the variance of the dataset is the least described across the Feature 1 axis and the maximum described across the Feature 2 axis. If ‘h’ is the variance of the data set across the Feature 2 axis (i.e., Variance of the Feature 2 vector) and ‘w’ is the variance of the dataset across the Feature 1 axis (i.e., Variance of the Feature 1 vector), then by looking at the dataset I can state h>>w.\n\nOn a visual basis, and with the fact that h>>w, I can arguably state that I can discard Feature 1 and keep only Feature 2 as the principal component that describes the maximum variance of the whole dataset.\n\n**Interpretation of FIGURE-2:**
\nHowever, the above is not the case in all instances and hence rises a need to explain a dataset as shown in FIGURE-2 wherein both Feature 1 and Feature 2 describe the variance of the dataset by a considerable significance.\nIn this case, we have to describe a new axis set of Feature 1’ and Feature 2’ which is the same as the original Feature 1 and Feature 2 axis set but turned by a specific angle(Ѳ) such that the maximum variance is described along either Feature 1’ or Feature 2’ axes. In the current case, the maximum variance is described along Feature 1’s axis. Hence, we can select Feature 1’ as our principal component and proceed further either to visualize or to pipeline our machine-learning model.\n
\n\n### **MATHEMATICAL OBJECTIVE FUNCTION**
\nLet us assume a dataset **D** given by **{X, Y}** where,
\n **X** is a random independent variable with ‘d’- features and ‘n’-data points and each data point is given by **xi** where **xi ϵ Rd**, a real space of d-dimensions.
\n**Y** is the dependent variable/target vector.\n\n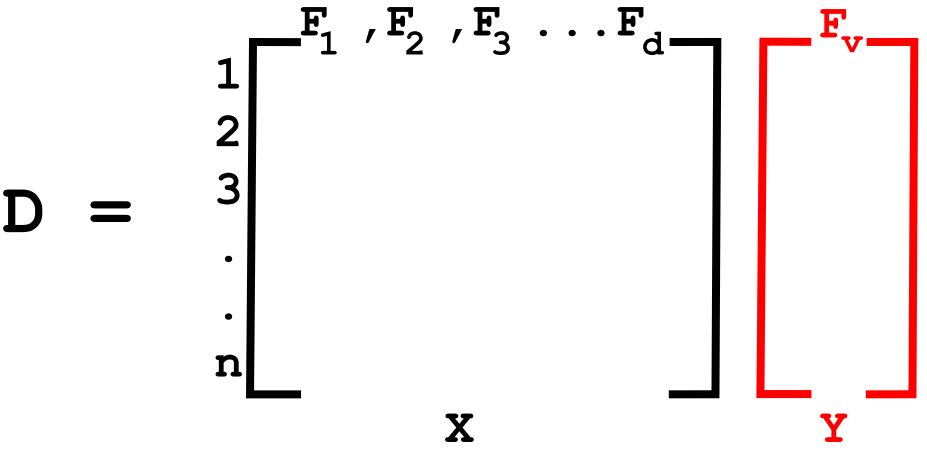\n\nX alone can be represented as,\n\n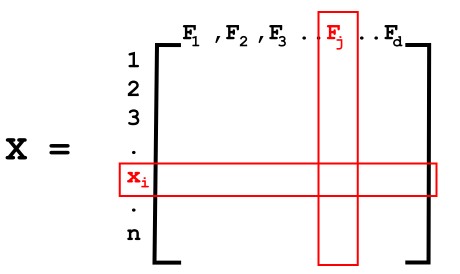
\nn - Number of rows meaning the number of data points (x1, x2, x3...xn)
\nd - Number of columns meaning the number of features (F1,F2,F3....Fd)\n\nBased on the interpretation of FIGURE-2, the objective of the PCA can be defined as finding a principal component axis (Feature 1’) on which the maximum variance of the whole dataset can be described.\n\nLet us consider a unit vector **u1** in the direction of such principal component axis **F1'**.
\n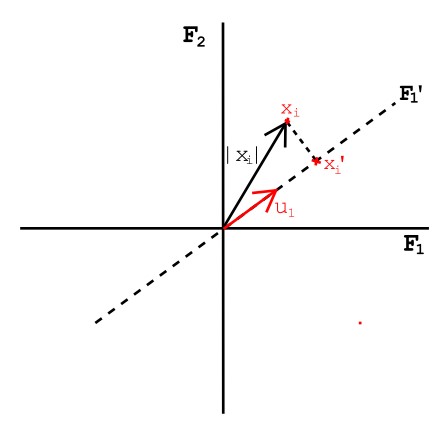
\nGiven any point **xi** in a d-dimensional space projected onto the direction of the unit vector **u1** and can be represented as,\n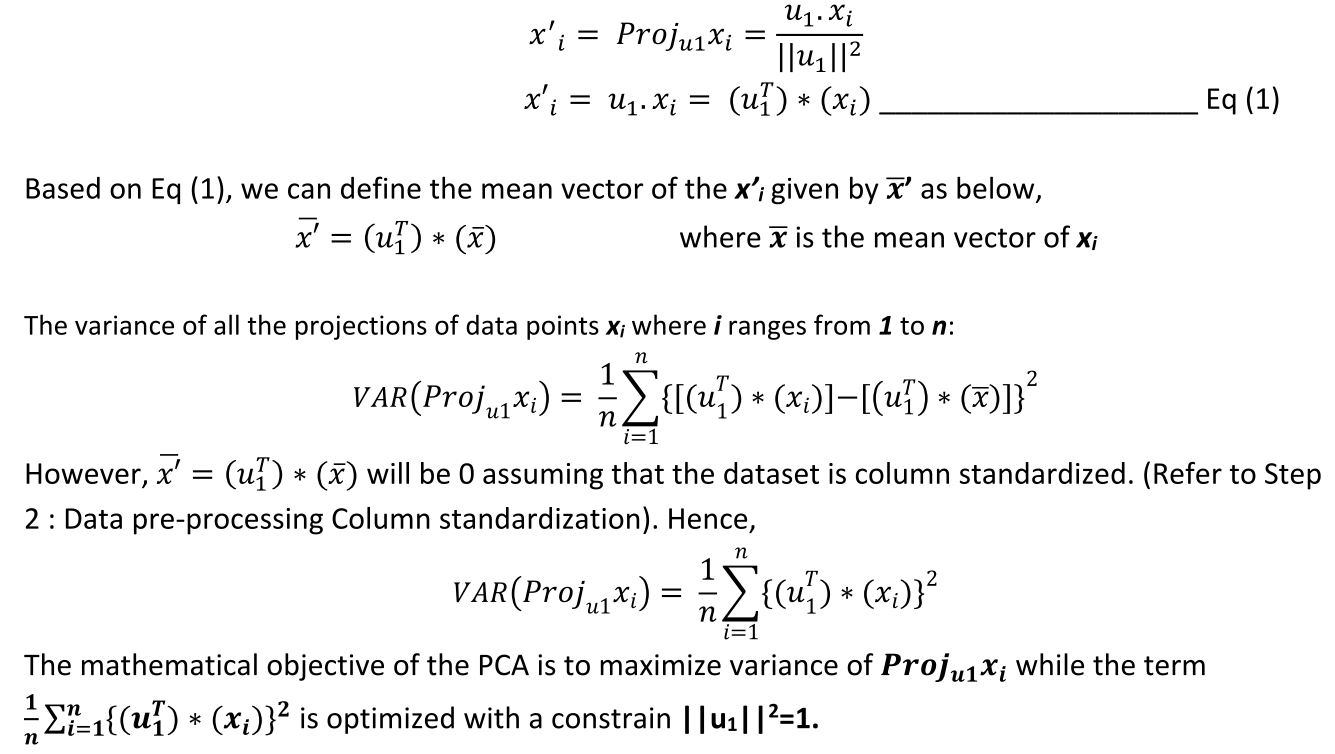\n
\n\n**STEPS IN DETERMINING PRINCIPAL COMPONENTS**
\nLet us define an empirical strategy to arrive at d’ principal component axis/axes for a given d-dimensional dataset. The process would involve the below steps to arrive at the required number of principal components.\n\n1.\tData pre-processing: Column Standardization\n2.\tBuild Covariance matrix for pre-processed data set\n3.\tCalculate Eigen values and vectors for the covariance matrix\n4.\tChoose the principal component axes
\n\nLet us look at each of these steps in detail.\n\n**1.\tData pre-processing: Column Standardization**
\nColumn standardization also known as Mean centering is a technique of scaling down any given distribution to a distribution with **mean=0** and **standard deviation=1**.\n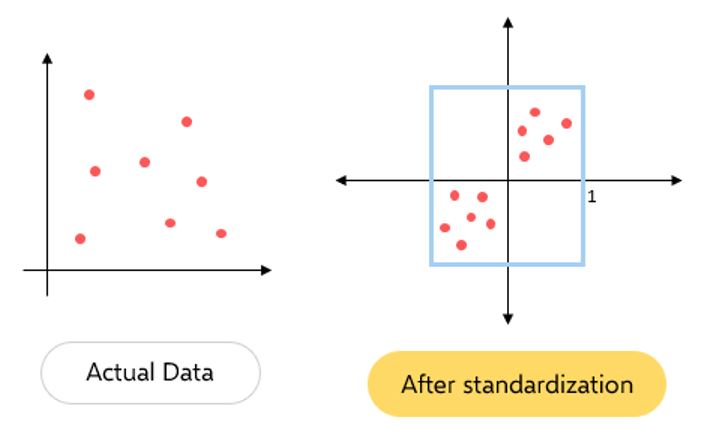\n\nThis can be achieved by applying the below equation to each data point of the feature column:\n**
xij = [xij - meanj] / Standard Deviationj**\n\nNOTE: Each feature column has to be standardized individually.\n\n**2.\tBuild Covariance matrix for pre-processed data set**
\nThe covariance matrix can be given as matrix **S** of size **d*d** given that each element **Sij** is the covariance between feature, **Fi** and feature, **Fj** of the variable X.
\nHence, Covariance Matrix is given as,\n**
S = (1/n) * XT. X**\n\n
\nwhere each element is given by,
**
Sij=COV(Fi, Fj)**\n\n**3.\tCalculate Eigen Values and Eigenvectors**
\nEigen vectors and Eigen values are the constructs of linear algebra that are to be computed from our covariance matrix.\n\nEigenvectors are those whose direction does not change upon performing linear transformation and Eigenvalues are the corresponding scalar entity of each of the Eigenvectors.\n\nIn other terms, Eigenvectors are those vectors that undergo pure scaling without any rotation and the scaling factor is called the Eigenvalue.\n\nThe definition of Eigen vectors and Eigen values can be given as,\n**
S. ν = λ. ν** __init__ Unlock the potential of data analysis using Excel through comprehensive steps, tools, and tips. This guide dives deep into crucial aspects such as data visualization, pivot tables, dynamic arrays, and more. Discover essential Excel tools and methods for efficient data analysis, ensuring you maximize the capabilities of this powerful software. Excel is such a versatile tool. Often underestimated, it's a powerhouse for data analysts. By tapping into its full potential, you can turn massive datasets into coherent insights that can drive decision-making. Whether you're in finance, marketing, or any data-driven field, mastering Excel is truly a game-changer. I'm passionate about using Excel for data analysis because it provides so much freedom and capability to users. Every time I leverage a new function or tool within Excel, it feels like unlocking a new level in a game. Let's dive in and uncover those levels together. Excel offers a vast array of tools for data visualization. These tools help users convert complex datasets into understandable graphical formats. Features include bar charts, pie charts, and line graphs. Presenting data visually helps in identifying trends, outliers, and patterns quickly. For powerful visualization, use Pivot Charts and Sparklines. Pivot Charts provide dynamic data representation and automatically adjust to highlight key metrics. Using advanced techniques, such as dynamic data ranges and custom templates, Excel can create engaging visual summaries. Utilize the Chart Design and Format tabs to refine and beautify your visual data. Graphical representation aids in making informed decisions and enhancing data storytelling. By mastering the art of visualization, you ensure crucial metrics are highlighted effectively. Add your personal touch to your visualizations. Use colors and designs that resonate with your audience. Make your charts more than just informative pieces, transform them into compelling stories that drive your point home. A well-crafted visualization can make your data powerfully attractive. Pivot Tables are my go-to for summarizing and analyzing data sets efficiently. They organize data into a pivot structure, allowing users to extract meaningful insights. Begin by selecting your data range and using the 'Insert Pivot Table' feature. This interactive component lets you drag and drop fields into different areas to customize reports. Advanced features, such as calculated fields and grouping, add depth to your analysis. Dynamic interaction with data through Pivot Tables provides a robust platform for exploring complex datasets. This is useful in financial modeling, market analysis, and operational reporting. Pivot Tables offer flexibility in analyzing multiple perspectives. Their adaptability makes them invaluable in professional data analysis using Excel. Dynamic Arrays are a revolutionary change in how Excel handles array formulas. These arrays resize automatically, accommodating dynamic data without manual adjustment. Using formulas like SORT, FILTER, and UNIQUE, Dynamic Arrays help manage and organize data efficiently. Dynamic Arrays enhance function capabilities, allowing arrays to spill into adjacent cells. This automatic expansion simplifies data manipulation and keeps your data analysis using Excel accurate. They are particularly useful in real-time data analysis. Learning to use Dynamic Arrays effectively can optimize your workflow. Incorporating Dynamic Arrays into your projects helps create adaptive solutions, crucial for contemporary data analysis tasks. Formula auditing is crucial in ensuring data accuracy. It allows users to trace and verify the accuracy of formulas, ensuring the integrity of data and calculations. Excel provides a Formula Auditing toolbar with tools like Trace Precedents, Trace Dependents, and Show Formulas. These tools help visually track the logic and flow of formulas within a worksheet. Error checking is another crucial aspect. Excel's error-checking features identify common issues such as #DIV/0!, #VALUE!, and #REF!. Utilizing these tools enhances transparency and understanding of complex formulas. Regular auditing maintains the accuracy of your data analysis using Excel. Conditional Formatting applies formatting to cells that meet specific criteria. This is useful for highlighting important data points, trends, or outliers. Create Conditional Formatting rules through the 'Home' tab. Select 'Conditional Formatting' and choose from preset rules like Data Bars, Color Scales, and Icon Sets. Custom rules can also be created using formulas. Advanced techniques include using nested formulas and combining multiple conditions. Efficient use of Conditional Formatting can make complex data more accessible and understandable. Implementing it effectively elevates your data analysis and presentation. This ensures critical insights are highlighted and easily interpreted. Inject color into your data life. Use Conditional Formatting to not only make your data informative but also visually appealing. Let Excel transform your data into a canvas of insights. Excel offers a wide range of chart types, each serving a different purpose. Choosing the right chart type can make a significant difference in how data is perceived and understood. Common chart types include bar charts, column charts, line charts, and pie charts. Each type suits different data analysis tasks. Advanced users can leverage combination charts and custom chart types for complex data. Excel's chart tools allow extensive customization, ensuring charts are tailored to specific needs. Choosing the right chart type depends on the data and the message you want to convey. For instance, line charts are excellent for showing trends over time. Creating effective charts in Excel requires understanding the data and the best ways to visually represent it. Data Cleaning prepares and corrects data to ensure its accuracy and reliability for analysis. This is crucial in any data analysis using Excel project. Common tasks include removing duplicates and handling missing values. Excel offers tools like Remove Duplicates, Find & Replace, and Data Validation to streamline these tasks. Using Power Query, users can automate data cleaning procedures, making the process more efficient. Data cleaning improves data quality, making it suitable for analysis. Consistent practices maintain data integrity over time. Investing time in data cleaning safeguards against errors and enhances the credibility of your analytical findings. Error Checking involves identifying and correcting mistakes in your data. This step ensures the reliability and accuracy of your analysis. Excel's built-in error-checking feature, accessible through the Formulas tab, highlights errors like #DIV/0!, #N/A, and #VALUE! Common errors include formula inconsistencies and misaligned ranges. Using tools like Data Validation and Conditional Formatting, users can mitigate these errors. Proactive error checking ensures data remains consistent and accurate. Excel is more than just a spreadsheet program; it's an effective data analysis tool that can draw insightful conclusions from unprocessed data. Users may effectively evaluate data and make valid conclusions by becoming proficient with Excel's advanced features, which include pivot tables, data visualization, statistical analysis tools, and the capacity to handle big datasets.
\nwhere,
\nS – Covariance matrix
\nν – Eigenvector
\nλ – Eigenvalue(Scalar value)\n\n**4.\tChoose the Principal Components**
\nSince our covariance matrix **S** is a **(d*d)** matrix we will get **d-eigenvalues** and **d-eigenvectors** respectively.
\nEigenvalues – λ1, λ2, λ3..... λd
\nEigenvectors – V1, V2, V3... Vd
\nWe arrange these eigenvalues in ascending order (λ1>λ2> λ3..... >λd): \n\nPrincipal Component 1: The eigenvector V1 corresponding to the maximal eigenvalue(λ1) gives the first Principal Component.\n\nPrincipal Component 2: The eigenvector V2 corresponding to the maximal eigenvalue (λ2) gives the second Principal Component...and so on.\n
\n\nIntuitively the Eigenvector corresponding to the highest Eigen value represents the direction of unit vector u1 we assumed while establishing the mathematical objective function of the PCA. \n\nAnd now because of PCA, we are able to reduce **any random variable X of d-dimensions to d’-dimensions such that d’
\n**1.\tLoss of variance can be considerably large:** While we try capturing the maximum possible variance by computing principal components, the variance or information lost across the non-principal axes could be considerably high.
\n**2.\tDifficulty in interpreting Principal components:** Each principal component is a linear combination of features and not a set of just important features. Hence, it is hard to interpret if a given feature is important for the given dataset.\n\n\n\n\n\n\n\n\n\n\n\n\n\n\n\n\n","blog_slug":"principal-component-analysis-a-dimensionality-reduction-technique","published_date":"September 10"}]},{"name_and_surname":"Annapoorna.M.N","short_description":"Annapoorna Completed UG at Seshadripuram Institute of Commerce and Management. She was adamant about learning the latest in business intelligence. To become knowledgeable about BI and pursue a career in it. After learning some of the ideas, she explored the tool more and found it fascinating.","twitter_url":"https://www.linkedin.com/in/annapoorna-mn-0b52371b5","linkedin_url":"https://www.linkedin.com/in/annapoorna-mn-0b52371b5","designation":"Power BI and SQL Developer, at Analogica, Bangalore.","image":{"localFile":{"childImageSharp":{"gatsbyImageData":{"layout":"constrained","backgroundColor":"#181818","images":{"fallback":{"src":"/static/be21b1ea0fe1e886666d41c8fc3512ab/51d77/Whats_App_Image_2022_11_15_at_15_12_52_93a8da2f5a.jpg","srcSet":"/static/be21b1ea0fe1e886666d41c8fc3512ab/9b056/Whats_App_Image_2022_11_15_at_15_12_52_93a8da2f5a.jpg 294w,\n/static/be21b1ea0fe1e886666d41c8fc3512ab/d40f2/Whats_App_Image_2022_11_15_at_15_12_52_93a8da2f5a.jpg 588w,\n/static/be21b1ea0fe1e886666d41c8fc3512ab/51d77/Whats_App_Image_2022_11_15_at_15_12_52_93a8da2f5a.jpg 1175w","sizes":"(min-width: 1175px) 1175px, 100vw"},"sources":[{"srcSet":"/static/be21b1ea0fe1e886666d41c8fc3512ab/9a2b7/Whats_App_Image_2022_11_15_at_15_12_52_93a8da2f5a.webp 294w,\n/static/be21b1ea0fe1e886666d41c8fc3512ab/61a09/Whats_App_Image_2022_11_15_at_15_12_52_93a8da2f5a.webp 588w,\n/static/be21b1ea0fe1e886666d41c8fc3512ab/57e02/Whats_App_Image_2022_11_15_at_15_12_52_93a8da2f5a.webp 1175w","type":"image/webp","sizes":"(min-width: 1175px) 1175px, 100vw"}]},"width":1175,"height":1591}}}},"blogs":[{"title":"At the moment, the market is demanding SQL, do you want to know why?","Descrption":"### **What is SQL?**\nStructured Query Language is known as SQL. You can use SQL to access and modify databases. In 1986, the American National Standards Institute (ANSI) and the International Organization for Standardization (ISO) recognized SQL as a standard.\n\n### **Why is SQL needed?**\n1. To create new databases, tables, and views.\n2. To insert records in a database.\n3. To update records in a database.\n4. To delete records from a database.\n5. To retrieve data from a database. \n\n### **What is the demand for SQL in the current situation?**\nBecause of the growing reliance on data and information, SQL developers are the most in-demand professionals. It's a career path that offers high pay, in-demand work, exposure to cutting-edge technology, and promising career opportunities.\n\n\n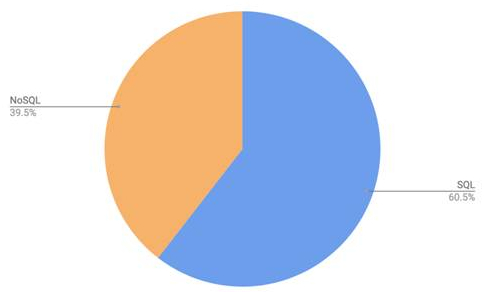\n\n\nThis Pie chart it is depicting that in the coming years SQL will be taking 100% as a programming language.\n\n### **Who can learn SQL?**\nSQL helps developers, product managers, and business analysts advance their careers. According to job boards, SQL is the most in-demand skill because it is a powerful and simple-to-learn programming language.\n\n### **Does SQL require a coding background?**\nLearning SQL does not require any algorithm or programming knowledge; simply understanding the relational database concept will help you identify the logic of the SQL query. SQL is founded on SET Theory.\n\n### **Which are the sectors that use SQL programming language?**\n\n\n### **What are the job roles offered after learning SQL?**\n1.\tSQL Server Developer\n2.\tSoftware Developer\n3.\tNet Developer\n4.\tBig Data Engineer\n5.\tBI Reporting Engineer\n6.\tBI Solution Architect (SME)\n7.\tSenior Oracle Database Administrator\n8.\tQuality Assurance Analyst\n9.\tQuality Assurance Tester\n10.\tBI Developer\n11.\tSQL Server Writer\n\n### **What are the top companies that recruit people who have completed SQL programming language and their average salary provided?**\n\n\n### **What is the duration for learning SQL?**\nAn average learner should be able to acquire the fundamentals of SQL and begin using SQL databases in roughly two to three weeks.\n\n### **What is the eligibility to learn SQL ?**\nSQL requires no prerequisites and is simple to learn. It is a query language that is similar to English. As a result, anyone who understands basic English can easily learn and write SQL queries. The good news is that most database engines are SQL code compatible.\n\nNow let us learn a few basic topics of SQL \n\n**Data:-** A data can be defined as a collection of facts or figures or information which is stored in or used by a computer.\n\n**a)\tDatabase:-** In simple words Data base can be termed as it acts as a storage unit where we store the data, retrieve data, bring data or update the data.\nExample:- Nowadays we use various e-commerce websites to purchase goods. These websites store the customers' information like name, address, frequent search, preferences, email address, etc\n\n**b)\tData Base Management System (DBMS):-** It is a software system which that helps the user to define the database, create the database, and maintain and control access to the database. In general terms, it is used to manage and organize data in a structured form.\n\nExamples:- MySQL, PostgreSQL, Microsoft Access, SQL Server, FileMaker, Oracle.\n\n**c)\tData Model:-** The term \"data model\" can be referred to as two distinct but related ideas. Data models are composed of entities, which are the objects or concepts about which we want to collect data, and they become the tables in a database.\nExample for data model:- Products, vendors, and customers\nThere are 4 types of Data models:-\n1.\tHierarchical Model\n2.\tNetwork Model\n3.\tEntity Relational Model\n4.\tRelational Model \n\n**1.\tHierarchical Model:-** A hierarchical database model is a data model that organizes data into a tree-like structure. The information is stored as records that are linked to one another.\nExample:- \n\n\n\n\n **2. Network Model:-** A network model is a database model that is designed to represent objects and their relationships in a flexible manner. \nExample:- \n\n\n\n\n**3.\tEntity Relational Model:-** The Entity-Relationship (ER) model is a graphical representation of the structure of a table as well as the relationships between logically related tables.\n\n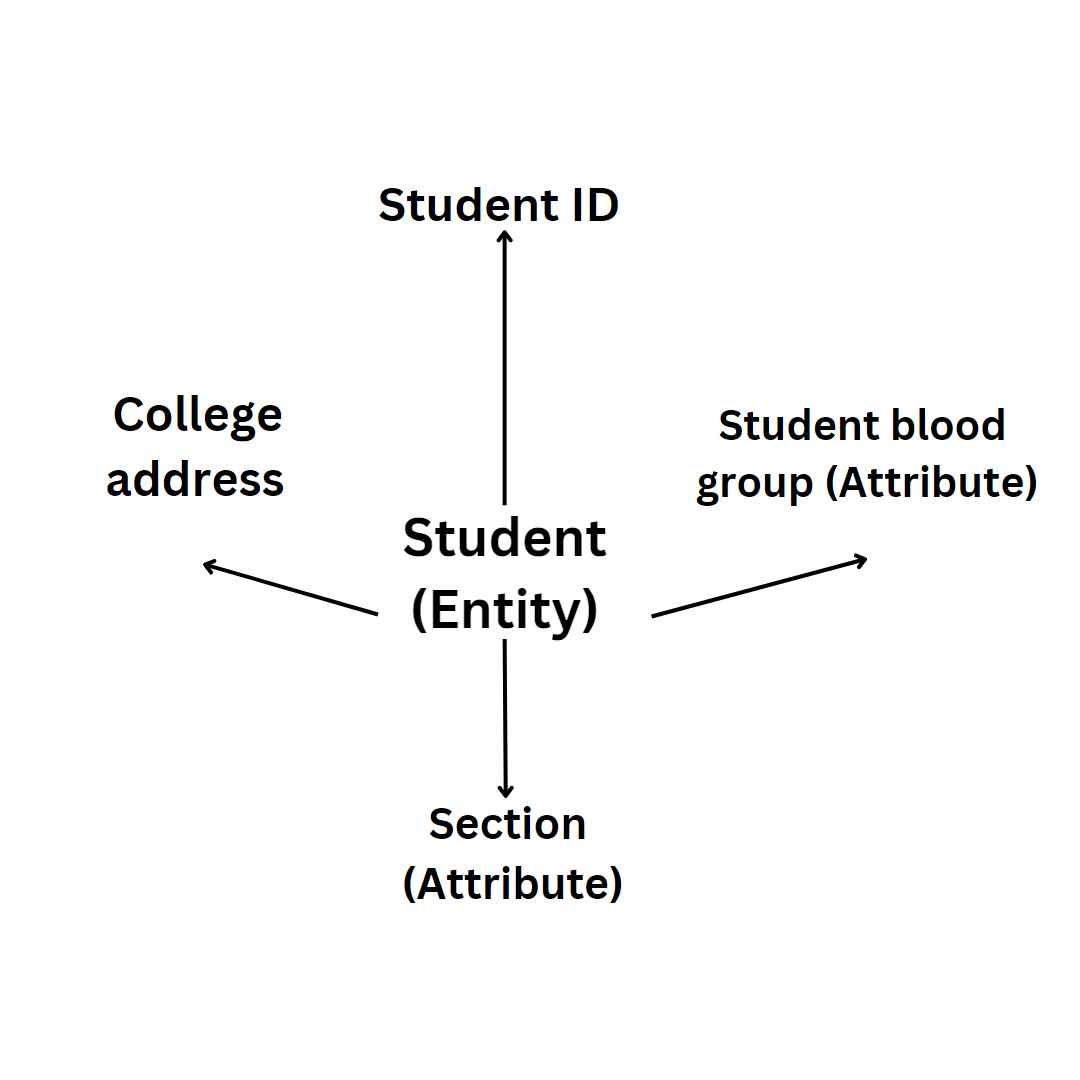\n\n\n**4.\tRelational Model:-** The relational model is a logical data structure (data tables, views, and indexes) that is distinct from physical storage structures. Because of this separation, database administrators can manage physical data storage without affecting logical data access.\nExample:- Excel \n\n**5.\tRelational Database Management System (RDBMS):-** A relational database management system is software that is used to store, manage, query, and retrieve data from a relational database (RDBMS). The RDBMS acts as a bridge between users, applications, and the database, as well as providing administrative functions for managing data storage, access, and performance.\nLooking into the different databases now lets us try to understand and relate how the database is connected with the data.\n\n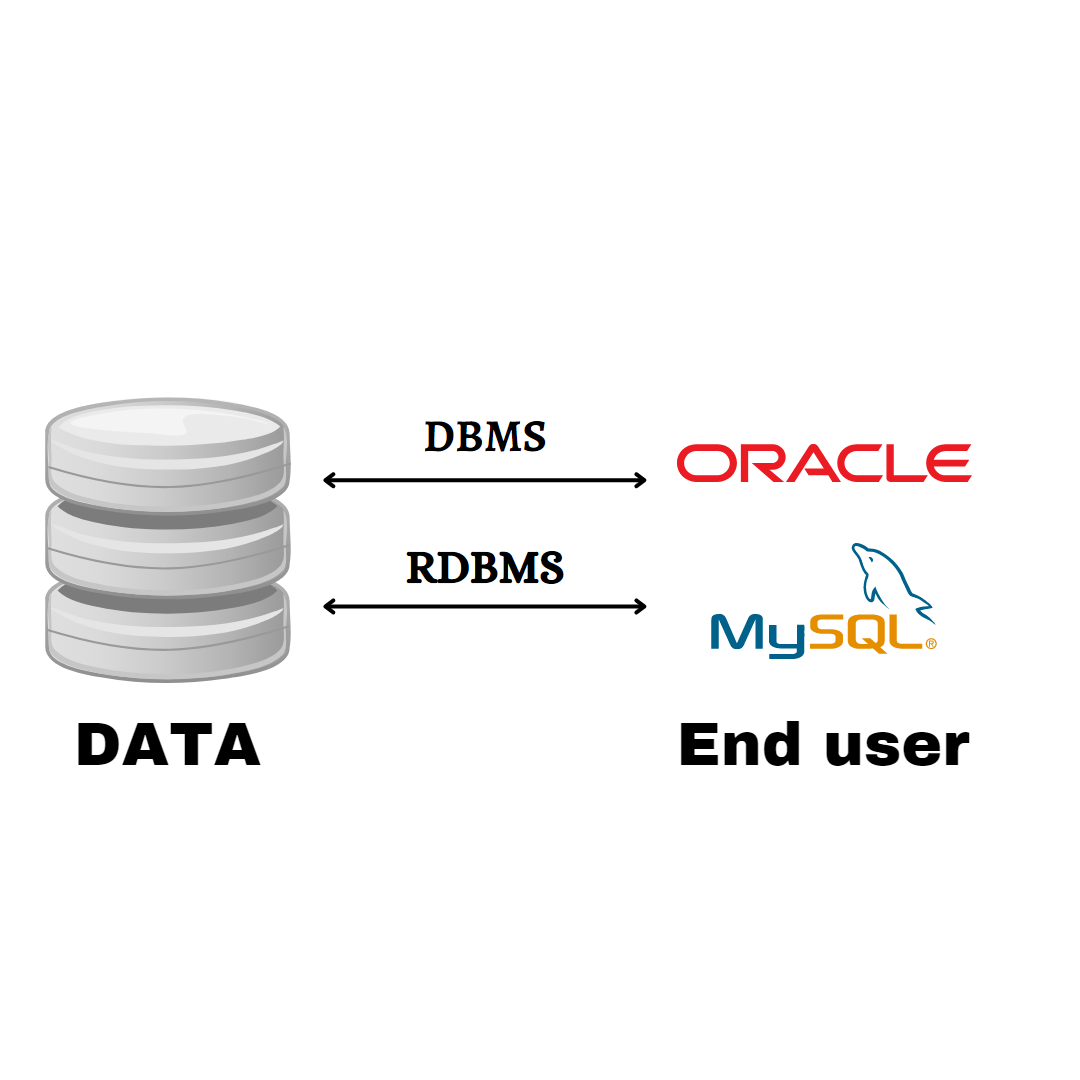\n\n\nBy looking into the picture let us try to understand how DBMS and RDMS are connected to data to retrieve, modify and store data.\n\nData is nothing but a collection of information that is stored in one place.DBMS is software that stores data, modify, and retrieve data. DBMS acts as an interlink between the end user and the data where we use languages such as Oracle, Microsoft SQL, etc to get the desired data. In the same way, RDBMS is also software but it stores the data in the form of tables(consisting of rows and columns) in a systematic form which can be easily stored on the end user's desktop.\n\nWhile writing SQL language we use commands to get the desired data\n\nThese commands can be classified under different categories.\n\n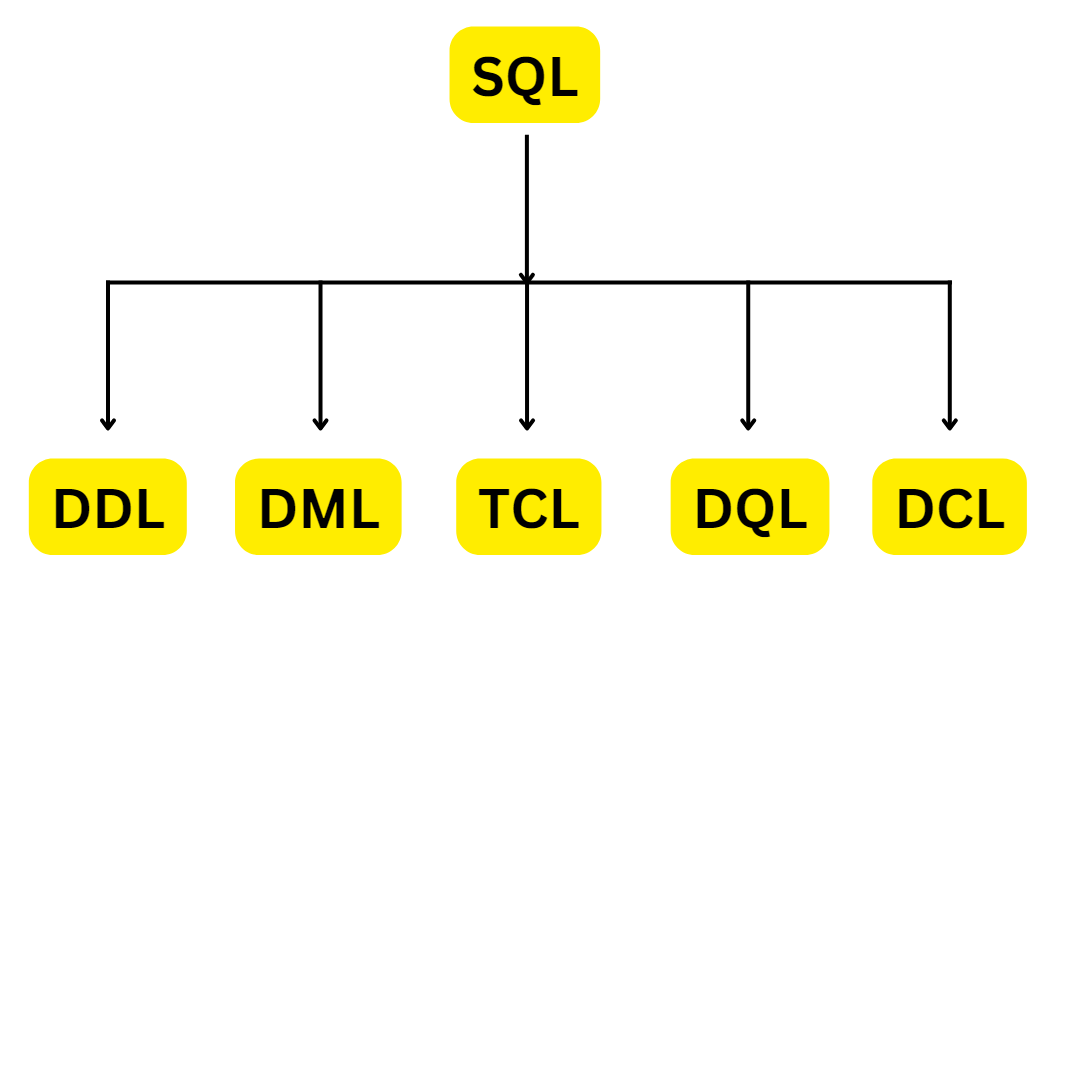\n\n\n**1) DDL (Data Definition Language ):-** DDL is a collection of SQL commands that are used to create, modify, and delete database structures but not data. A user should access the database through an application, not through these commands.\nList to commands which come under DDL:-\n\n**a)Create:-** This command is used to create databases like creating tables, indexes, functions, etc \n\n**b)Drop:-** This command is used to delete information from the database as well as a database.\n\n**c)Alter:-** This is used to change the database's structure.\n\n**d)Truncate:-** This command is used to delete all records permanently even if the auto-commit is 0.\n\n**e)Comment:-** This command is used to add comments to the data dictionary.\n\n**f)Rename:-** This command is used to rename the column.\n\n\n**2) DQL(Data Query Language):-** This command allows you to extract data from the database in order to perform operations on it. The DQL Command's purpose is to obtain some schema relation based on the query.\n\n**a)Select:-** This command is used to get all the data from a particular database.\n\n\n**3) DML(Data Manipulation Language):-** The SQL commands that deal with the manipulation of data in the database are classified as DML, which includes the majority of SQL statements. \n\n**a)Insert:-** This command is used to add data inside the table.\n\n**b)Update:-** This command is used to update the existing data within a database.\n\n**c)Delete:-** This command is used to delete records from a database.\n\n**d)Lock:-** This command is used to control table concurrency.\n\n\n\n**4) DCL (Data Control Language):-** DCL includes commands like GRANT and REVOKE that deal with the database system's rights, permissions, and other controls.\n\n**a)Grant:-** This command is used to give users database access privileges.\n\n**b)Revoke:-** This command is used to withdraw the access which is given to the users which are given by the grant command.\n\n\n**5) TCL (Transaction Control Language ):-** This command deals with the transaction within the database.\n\n**a)Commit:-** This command can be used to commit the transaction.\n\n**b)Rollback:-** This command is used to roll back the transaction when we commit any errors.\n\n**c)Savepoints:-** This command is used to set the savepoint within the transaction.\n\n**d)Set Transaction:-** This command specifies the transaction's characteristics.\n\n\n\n\n**Conclusion:-** So at the end of this blog I hope all the readers have got some of the info about SQL.\n","blog_slug":"at-the-moment-the-market-is-demanding-sql-do-you-want-to-know-why","published_date":"Dec 5"},{"title":"Join me in merging the join kind","Descrption":"#### **Power Bi is a Business Intelligence and Data Analytics Solution that helps us get insight into the data from different sources and allows us to prepare reports and dashboards.**\n\n**What is Power BI used for?**
\nPower BI is a set of software services, apps, and connectors that work together to transform disparate data sources into coherent, visually impressive, and interactive insights. Your data could be in the form of an Excel spreadsheet or a collection of hybrid cloud-based and on-premises data warehouses.\n\n**What is Merge in Power BI?**
\nA merge queries operation connects two existing tables based on matching values in one or more columns.\n\n**What is the use of Merge in Power BI?**
\nA merge query combines two existing queries to form a new one. All columns from a primary table are contained in a single query result, with one column serving as a single column containing a relationship to a secondary table. The related table contains all rows that have a common column value with each row from the primary table.\n\n**What is the join kind in Merge?**
\nCombining two datasets in Power Bi using the merge query option. While performing merge queries you will be asked for a join kind ie the two datasets which you have decided to merge their rows should match the same. While performing a merge at least one column should be the same in both datasets.\n\n**When to use Join Kind?**
\nIn a certain situation, you require to merge the two datasets for appropriate or complete information for the preparation of an effective visualization\n\nLet us try to understand the types of joins which is used for merging queries.
\n \n
\n**1. Outer Join:-** In this type of join, we get the values that are present in both datasets, and missing values will not be shown.
\n
\n**a)Left Outer:-** In this, the 1st table will be considered as the main table, and the 2nd table will be considered a secondary table. When we perform left outer join you will whatever values are present in the main table (1st table ) will be matched with the second table (Secondary table )
\n\nLet us try to understand this with an example
\n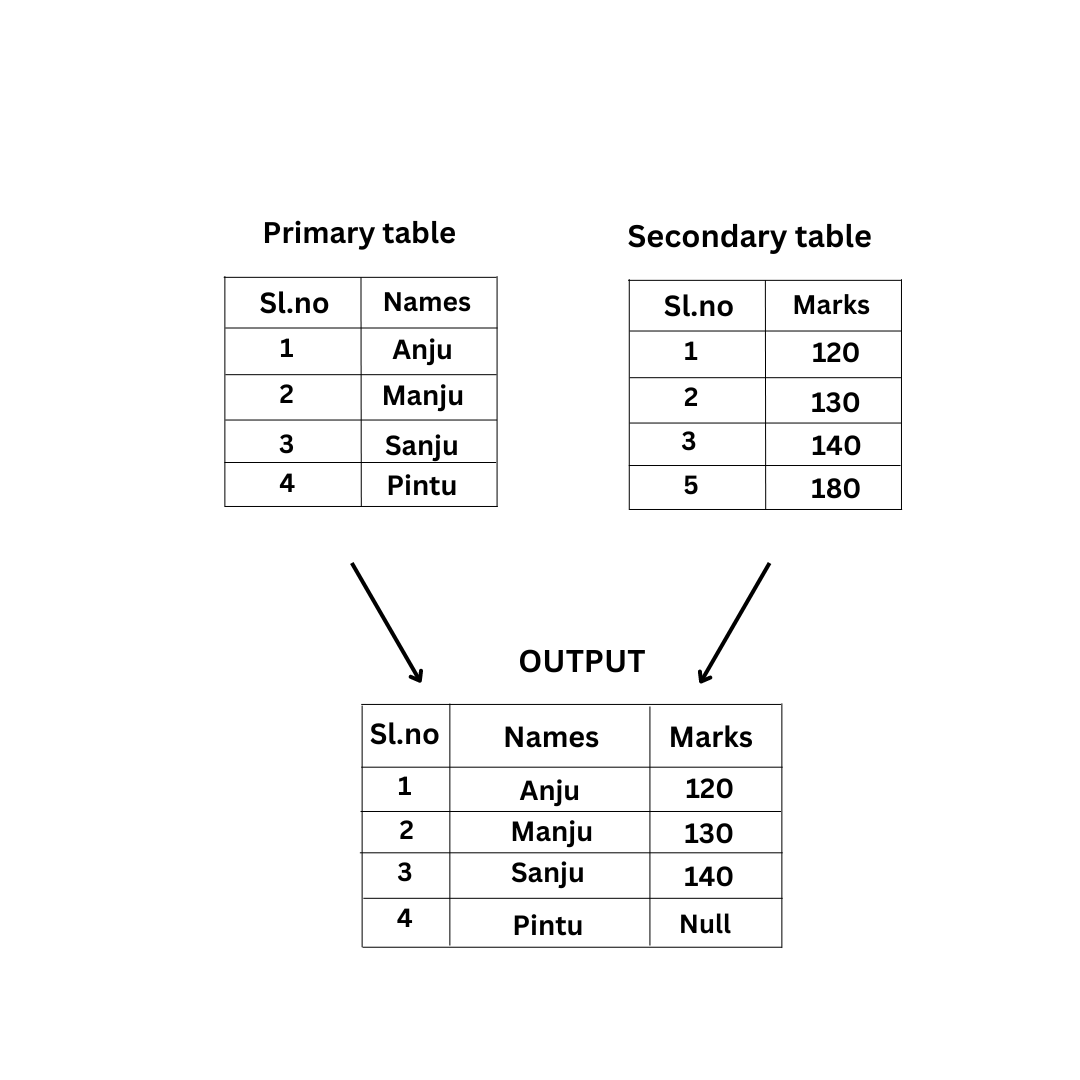
\n**b)Right Outer Join:-** In this, the secondary table will be considered as the primary table ie it keeps all the rows from the secondary table and brings the matching rows from the primary table.
\n\nLet us try to understand this with an example
\n
\n**c)Full Outer:-** In this, you will get all the values present in both the data sets while doing merge operations ie which brings in all the rows from both the left and right tables \n\nLet us try to understand this with an example
\n\n **2. Anti join:-** An anti join displays those values where there is no match found in the corresponding table \n**a)Left Anti:–** In this type of join, it brings in only rows from the primary table that don’t have any matching rows from the secondary table.
\n\nLet us try to understand this with an example\n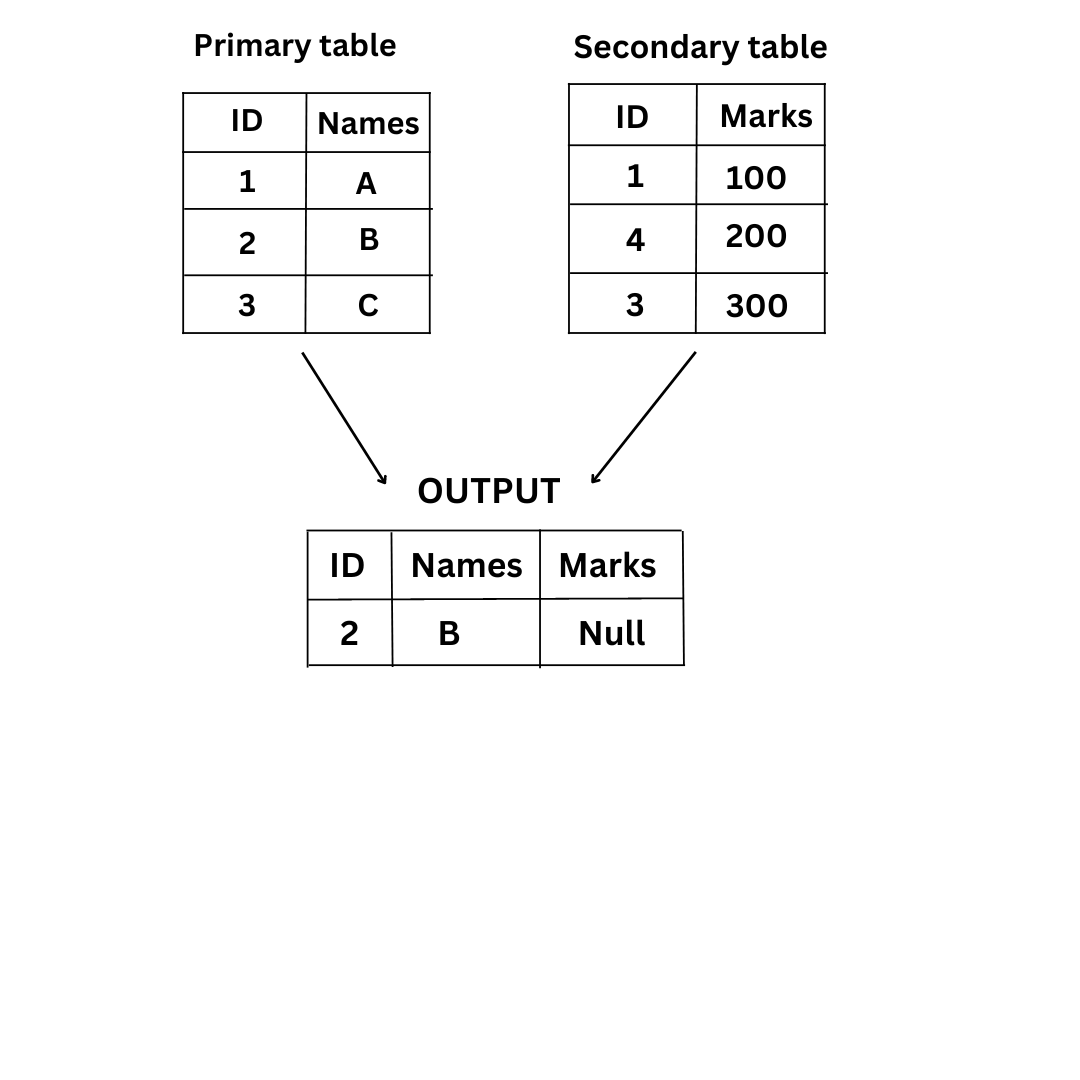
\n**b)Right Anti:-** It brings in only rows from the secondary table that don’t, have any matching rows from the primary table.
\nLet us try to understand this with an example
\n
\n**c)Inner Anti:-** It brings only rows from both primary and secondary tables that have all the matching rows.
\nLet us try to understand this with an example
\n
\n**Conclusion:** By looking into all these types of joins which can be used during the merge operations for effective visualization and for business analysis for the further decision-making process.\n","blog_slug":"join-me-in-merging-the-join-kind","published_date":"Nov 20"}]},{"name_and_surname":"Barnaba Daniel","short_description":"Barnaba Daniel is a Cyber Security Analyst with Analogica Software development PVT LTD. He also mentors young Cyber Security students with Certisured EdTech. Barnaba is highly passionate about Hacking and Cyber Security.","twitter_url":null,"linkedin_url":"https://www.linkedin.com/in/barnaba-daniel-2741b9249","designation":"Cybersecurity Analyst","image":{"localFile":{"childImageSharp":{"gatsbyImageData":{"layout":"constrained","backgroundColor":"#080808","images":{"fallback":{"src":"/static/7451081a8e597e84d83577e8299ddb16/ce421/certisured_barnaba_2022_08_09_at_12_5dce692950.jpg","srcSet":"/static/7451081a8e597e84d83577e8299ddb16/70bc7/certisured_barnaba_2022_08_09_at_12_5dce692950.jpg 80w,\n/static/7451081a8e597e84d83577e8299ddb16/5c7a7/certisured_barnaba_2022_08_09_at_12_5dce692950.jpg 160w,\n/static/7451081a8e597e84d83577e8299ddb16/ce421/certisured_barnaba_2022_08_09_at_12_5dce692950.jpg 319w","sizes":"(min-width: 319px) 319px, 100vw"},"sources":[{"srcSet":"/static/7451081a8e597e84d83577e8299ddb16/a4f2d/certisured_barnaba_2022_08_09_at_12_5dce692950.webp 80w,\n/static/7451081a8e597e84d83577e8299ddb16/ef054/certisured_barnaba_2022_08_09_at_12_5dce692950.webp 160w,\n/static/7451081a8e597e84d83577e8299ddb16/406f0/certisured_barnaba_2022_08_09_at_12_5dce692950.webp 319w","type":"image/webp","sizes":"(min-width: 319px) 319px, 100vw"}]},"width":319,"height":358}}}},"blogs":[{"title":"Information security","Descrption":"Information security, also known as cyber security or IT security, is the practice of protecting sensitive information from unauthorized access, use, disclosure, disruption, modification, or destruction. In today's digital age, where almost all information is stored and transmitted electronically, information security is more important than ever.\n\nOne of the main goals of information security is to ensure the confidentiality, integrity, and availability of information. Confidentiality refers to keeping information private and only allowing authorized individuals to access it. Integrity refers to ensuring that information is accurate and has not been tampered with. Availability refers to ensuring that authorized individuals can access information when they need it.\n\nOne of the most important aspects of information security is protecting against external threats, such as hacking, malware, and phishing attacks. These types of attacks are becoming more sophisticated and frequent, and they can have severe consequences for individuals and organizations. To protect against these threats, it's important to use strong passwords and keep them unique to each account, use anti-virus and anti-malware software, and regularly update all software and operating systems. Additionally, employees should be trained to identify and avoid phishing attempts.\n\nAnother important aspect of information security is protecting against internal threats. These threats can come from employees, contractors, or other insiders who have access to sensitive information. To protect against internal threats, it's important to conduct background checks on employees, monitor for suspicious activity, and limit access to sensitive information to only those who need it. Additionally, information should be classified and labeled, and employees should be trained to handle and protect sensitive information.\n\nOne of the most important practices to protect information security is to have an incident response plan. An incident response plan is a set of procedures that an organization can follow in the event of a security incident, such as a data breach or a malware infection. The plan should outline the roles and responsibilities of different team members, the steps that should be taken to contain and eliminate the incident, and the steps that should be taken to prevent similar incidents in the future. Organizations should also conduct regular incident response drills to ensure that everyone knows what to do in the event of an incident.\n\nCompliance is another important aspect of information security. Many organizations must comply with laws and regulations that govern how they can handle and protect sensitive information. For example, healthcare organizations must comply with the Health Insurance Portability and Accountability Act (HIPAA) which provides a guideline for handling and protecting personal health information, and financial institutions must comply with the Gramm-Leach-Bliley Act which provides guidelines for protecting personal financial information. Compliance with these laws and regulations can be a complex and time-consuming process, but it is essential to avoid penalties and protect sensitive information.\n\nInformation security is a constantly evolving field, and new threats and vulnerabilities are discovered on a regular basis. Organizations must stay current with the latest threats and vulnerabilities and adapt their security practices accordingly. This can be achieved through regular security assessments and penetration testing, continuous employee training, and regular updates on the technology used.\n\nIn conclusion, information security is an essential practice in today's digital age. It is important for organizations to protect sensitive information from unauthorized access, use, disclosure, disruption, modification, or destruction. To do this, organizations must protect against external and internal threats, have an incident response plan in place, and comply with laws and regulations. Additionally, it's important to stay current with the latest threats and vulnerabilities, adapt their security practices accordingly, and always be proactive in ensuring the safety of their information.\n\nA real-time example of the importance of information security can be seen in the ongoing threat of ransomware attacks. Ransomware is a type of malware that encrypts a victim's files and demands a ransom payment in exchange for the decryption key. These attacks have become increasingly common in recent years and have affected organizations of all sizes, from small businesses to large corporations.\n\nOne high-profile example of a ransomware attack is the attack on the Colonial Pipeline in May 2021. The attack resulted in the shutdown of a major U.S. pipeline, causing fuel shortages and panic buying in several states. The attackers used ransomware to encrypt the company's files and demanded a ransom payment of nearly $5 million. The company initially declined to pay the ransom, but later chose to pay it in order to get the decryption key and get the pipeline back online. The attack resulted in major disruption and financial losses for the company, as well as caused panic among consumers.\n\nAnother example is the attack on the Irish healthcare system in May 2021. The attack caused severe disruption to the healthcare system, with patients being turned away from hospitals and surgeries being canceled. The attackers used ransomware to encrypt the system's files and demanded a ransom payment of over €20 million.\n\nThese examples demonstrate the severe consequences that can result from a ransomware attack and the importance of having strong information security practices in place. Organizations must take steps to protect themselves from these types of attacks, such as regularly backing up important files, using anti-virus and anti-malware software, and training employees to identify and avoid phishing attempts. It's also important to have an incident response plan in place in case of an attack and to make sure that security teams can detect and respond quickly to a ransomware incident. Additionally, it’s important to have cyber insurance that could cover some of the losses caused by the attack.\n\nIn both of these examples, the companies decided to pay the ransom and get the key. But this should be avoided as it could incentivize more attacks to happen. It is important to have a well-established incident response plan that involves multiple layers of defense, with a preference for data backup, instead of giving into a ransom.\n","blog_slug":"information-security","published_date":"11 Jan 2023"},{"title":"Cyber bullying","Descrption":"Cyberbullying refers to the use of electronic communication devices, such as computers, smartphones, and tablets, to engage in repeated, aggressive behavior that is intentional and involves an imbalance of power or strength. It can take various forms, including sending threatening messages, spreading rumors or false information, posting embarrassing photos or videos without consent, or excluding someone from online social groups.
\n\nAccording to the Cyberbullying Research Center, about one in three young people have experienced cyberbullying, and about one in four have engaged in cyberbullying behavior. It can have serious consequences, including depression, anxiety, low self-esteem, and in extreme cases, suicide.One of the main challenges with cyberbullying is that it can happen anytime, anywhere, and often goes unreported or unnoticed by adults. It can also be difficult to trace the source of the bullying, as perpetrators often use anonymous accounts or fake profiles.
\n\n\n\n**There are several ways to prevent or respond to cyberbullying. Here are a few tips for young people:**\n\n- Don't respond to the bully. This can escalate the situation and give the bully more power. Instead, try to ignore the bully and save the evidence in case you need to report the incident.\n- Reach out for help. Talk to a trusted adult, such as a parent, teacher, or counselor, about what is happening. They can help you come up with a plan to stop the bullying and provide emotional support.\n- Use the blocking and reporting features on social media platforms and other online tools. This can help prevent the bully from contacting you and make it easier to report the incident.\n- Take care of yourself. Find ways to manage stress, such as exercising, meditating, or spending time with friends and loved ones.\n\n**For parents and educators, here are some ways to address cyberbullying:**\n\n- Educate young people about the risks and consequences of cyberbullying. This can help prevent it from happening in the first place.\n- Encourage open communication. Let young people know that they can come to you for help and support if they are being bullied or if they see someone else being bullied.\n- Monitor online activity and set boundaries. This can help you spot any potential issues and intervene if necessary.\n- Get involved in your child's online life. Know what social media platforms they are using and who they are connecting with online.\n- Teach young people how to be responsible digital citizens. This includes respecting others' boundaries and privacy, being mindful of what they post online, and not engaging in cyberbullying behavior.\n\nIn addition to these prevention and response strategies, it is important for schools, communities, and policymakers to take action to address cyberbullying. This can include implementing anti-bullying policies and programs, providing training for educators and parents, and working with law enforcement to investigate and prosecute cases of cyberbullying.
\n\nIn conclusion, cyberbullying is a serious issue that can have lasting impacts on young people's mental health and well-being. It is important for individuals, families, and communities to take steps to prevent and respond to cyberbullying to create a safer, more respectful online environment for all.\n\n\n\n","blog_slug":"cyber-bullying","published_date":"3 Jan 2023"},{"title":"Digital Attacks ","Descrption":"Digital attacks, also known as cyber-attacks or online attacks, are a growing concern for individuals, businesses, and organizations around the world. These attacks can take many forms, including malware, phishing, ransomware, and more, and can have serious consequences, such as theft of sensitive information, financial losses, and damage to reputation.\n\nOne common type of digital attack is malware, which is short for \"malicious software.\" This is any software that is designed to harm or exploit a computer system. There are many different types of malware, including viruses, worms, and Trojans. A virus is a piece of code that is designed to replicate itself and spread from one computer to another, often through email attachments or downloaded files. A worm is similar to a virus, but it is able to self-replicate and spread without the need for a host file. A Trojan is a type of malware that is disguised as legitimate software but is actually designed to gain access to a user's computer and steal sensitive information.\n\n\n\nAnother common type of digital attack is phishing, which is a technique used by hackers to trick individuals into revealing sensitive information, such as passwords and credit card numbers. This is often done through fake emails or websites that appear to be legitimate, but are actually designed to steal personal information.\n\nRansomware is another type of digital attack that has gained notoriety in recent years. This is a type of malware that encrypts a victim's data, making it inaccessible until a ransom is paid to the attackers. Ransomware attacks can be particularly devastating for businesses, as they may lose access to critical data and systems until the ransom is paid.\n\nDigital attacks can also take the form of DDoS (Distributed Denial of Service) attacks, which are designed to overwhelm a website or network with traffic, making it unavailable to users. These attacks are often carried out by a network of compromised computers, known as a \"botnet.\"\n\n\n\n\nThe consequences of digital attacks can be serious and can include financial losses, theft of sensitive information, and damage to reputation. For individuals, this can include the theft of personal information, such as passwords and credit card numbers, which can lead to financial losses and identity theft. For businesses and organizations, digital attacks can result in lost productivity, financial losses, and damage to reputation.\n\nThere are a number of steps that individuals and organizations can take to protect themselves from digital attacks. One of the most effective ways to protect against malware is to install and regularly update antivirus software. It is also important to be cautious when opening emails or downloading files from unfamiliar sources.\n\nTo protect against phishing attacks, it is important to be skeptical of emails or websites that request personal information or login credentials. It is also a good idea to use two-factor authentication whenever possible, as this adds an extra layer of security to online accounts.\n\n\n\n\nTo protect against ransomware attacks, it is important to regularly back up important data, as this will allow you to restore your data if it is encrypted by ransomware. It is also a good idea to keep software and security systems up to date, as this can help to prevent vulnerabilities that could be exploited by attackers.\n\nDDoS attacks can be more difficult to protect against, as they often involve a large number of compromised computers. One way to protect against DDoS attacks is to use a web application firewall (WAF), which can help to filter out malicious traffic.\n\nIn conclusion, digital attacks are a growing concern for individuals, businesses, and organizations around the world. These attacks can take many forms and can have serious consequences, including financial losses, theft of sensitive information, and damage to reputation. To protect against digital attacks, it is important to take steps such as installing\n","blog_slug":"digital-attacks","published_date":"7 Jan 2023"},{"title":"Network security","Descrption":"Network security is the practice of protecting the integrity, confidentiality, and availability of information that is transmitted over a network. This can include both wired and wireless networks, as well as both private and public networks.\n\nOne of the main goals of network security is to protect against unauthorized access, use, disclosure, disruption, modification, or destruction of information. This can be achieved through a variety of different techniques, such as firewalls, encryption, and secure protocols.\nFirewalls are one of the most widely used tools for network security. A firewall is a network security system that monitors and controls the incoming and outgoing network traffic based on predetermined security rules. Firewalls can be hardware-based, software-based, or a combination of both. They can be configured to block certain types of traffic, such as traffic from known malicious IP addresses or traffic that is using insecure protocols.\n\nEncryption is another important tool for network security. Encryption is the process of converting plaintext into unreadable ciphertext in order to protect the confidentiality of the information being transmitted. There are many different encryption algorithms available, such as AES and RSA, and different encryption strengths, depending on the level of security needed.\n\nSecure protocols, such as HTTPS and SSH, are also commonly used to protect information being transmitted over a network. These protocols use encryption and other security measures to ensure that the information being transmitted is only accessible by authorized parties.\n\nIn addition to these technical measures, it is also important to have policies and procedures in place to ensure that the network is used in a safe and secure manner. This can include policies on password strength and expiration, as well as policies on what types of devices are allowed to connect to the network.\n\nAnother important aspect of network security is monitoring and incident response. Network administrators should monitor the network for suspicious activity, such as unusually high traffic or failed login attempts. If an incident is detected, a well-defined incident response plan should be in place to minimize the impact of the incident and prevent future incidents from occurring.\n\nIn conclusion, network security is a vital aspect of modern business and communication, and it involves a combination of technical measures, policies and procedures, and incident response. With the increasing amount of data and the reliance on technology, the need for network security is more critical than ever, to protect the integrity, confidentiality, and availability of the information.\n\nA real-world example of network security in action is a company that utilizes a firewall to protect its network. The company may have a policy in place that only allows traffic from specific IP addresses or using specific protocols to access their network. The firewall is configured to block any traffic that does not meet these criteria.\n\nFor example, let's say that the company's policy only allows HTTPS traffic to access their website. The firewall is configured to block all HTTP traffic, ensuring that any sensitive information being transmitted, such as login credentials or financial data, is protected by the secure HTTPS protocol.\n\nIn addition to the firewall, the company may also use encryption to protect sensitive information being transmitted over the network. For example, they may use AES encryption to protect sensitive files that are being stored on the network and RSA encryption to protect confidential emails being sent between employees.\n\nThe company may also have monitoring and incident response protocols in place to detect and respond to any security breaches. For example, they may use intrusion detection systems to detect any suspicious activity on the network, such as a high volume of failed login attempts or traffic from known malicious IP addresses. If an incident is detected, the incident response team is notified and takes the appropriate action to minimize the impact of the incident and prevent any further breaches.\n\nOverall, in this scenario, the company is using a combination of technical measures such as firewall and encryption and policies such as only allowing specific protocols and IPs, in addition to monitoring and incident response protocols to protect their network and the information transmitted over it, all these measures together will help the company to minimize the risk of unauthorized access or data breaches, and will provide a better security level for their network.\n","blog_slug":"network-security","published_date":"11 Jan 2023"},{"title":"Hacking","Descrption":"### This is the conversation between Ramu and Shamu about Hacking...!\n\n\n\n**Ramu:** Hey Shamu, have you heard about ethical hacking? It's like regular hacking, but with morals!
\n**Shamu:** Ha ha, very funny Ramu. Yeah, I know what ethical hacking is. It's when hackers use their skills to test the security of a computer system or network but in a legal and authorized way.
\n\n**Ramu:** Yeah, exactly. It's like the superheroes of the hacking world. They're the good guys, fighting to keep our systems and data safe from the evil black hat hackers.
\n**Shamu:** Speaking of black hat hackers, have you heard the one about the hacker who tried to steal a bank's data but ended up getting locked out of his own computer?
\n\n**Ramu:** No, I haven't. But I've heard the one about the hacker who tried to access a secure system using the password \"password.\" He ended up getting hacked himself!
\n**Shamu:** Ha ha, those are some good ones. So, getting back to ethical hacking, how does someone become an ethical hacker?
\n\n**Ramu:** Well, it helps to have a solid foundation in computer science and programming. But even if you don't have a formal education, there are plenty of online resources and training programs that can teach you the skills you need.
\n**Shamu:** Interesting. And what kind of work do ethical hackers do?
\n\n**Ramu:** They do a lot of different things, like penetration testing, vulnerability assessments, and security assessments. Basically, they try to find and fix any weaknesses in a system before the bad guys can exploit them.
\n**Shamu:** That sounds like a pretty important job.
\n\n**Ramu:** It definitely is. Ethical hacking requires a lot of technical knowledge, as well as the ability to think creatively and critically. And it's important to stay up-to-date on the latest trends and techniques in the field.
\n**Shamu:** Yeah, no kidding. Well, I'm glad we have ethical hackers out there working to keep our systems and data safe. Thanks for explaining it to me, Ramu.
\n\n**Ramu:** No problem, Shamu. It's always important to educate people about the role of ethical hacking in keeping our digital world secure.
\n**Shamu:** So, Ramu, you mentioned a few different tasks that ethical hackers do, like penetration testing and vulnerability assessments. Could you explain more about what those are?
\n\n**Ramu:** Sure, Shamu. Penetration testing, also known as pen testing, is when an ethical hacker simulates a cyber attack on a computer system or network to test its defenses and identify vulnerabilities. It's a way to see how well the system can withstand a real attack.
\n**Shamu:** Okay, I see. And what about vulnerability assessments?
\n\n**Ramu:** A vulnerability assessment is a process of identifying, classifying, and prioritizing vulnerabilities in a system or network. It's a way to identify weaknesses that could potentially be exploited by a hacker.
\n**Shamu:** Got it. And what is a security assessment?
\n\n**Ramu:** A security assessment is an evaluation of the security of a system or network, including the identification and assessment of vulnerabilities. It's a more comprehensive look at the overall security posture of a system.
\n**Shamu:** Okay, I think I understand. So ethical hackers perform these tasks to help organizations improve their security and protect against cyber attacks.
\n\n**Ramu:** That's right, Shamu. Ethical hacking is a valuable tool for organizations to use to identify and fix vulnerabilities before they can be exploited by malicious hackers. It's an important part of maintaining a strong cybersecurity posture.
\n**Shamu:** So, Ramu, I'm curious - how much do ethical hackers make as a salary?
\n\n**Ramu:** It can vary depending on the specific role and the level of experience. In India, ethical hackers with entry-level positions may start at a salary of around 400,000 INR per year. More experienced ethical hackers, such as those with management responsibilities, can earn salaries of up to 1,500,000 INR or more per year.
\n**Shamu:** Wow, that's a pretty wide range. What factors influence the salary of an ethical hacker?
\n\n**Ramu:** There are a few different factors that can influence an ethical hacker's salary. These include the specific role they are in, their level of education and experience, the company they work for, and the location of the job. In general, ethical hackers who have advanced degrees and a strong skill set tend to earn higher salaries.
\n**Shamu:** That makes sense. So what are some common roles that ethical hackers might have?
\n\n**Ramu:** Some common roles for ethical hackers include penetration testers, security analysts, and cybersecurity consultants. Each of these roles has its own set of responsibilities and job requirements, and the salaries can vary accordingly.
\n**Shamu:** Interesting. Thanks for explaining it to me, Ramu.
\n\n**Ramu:** No problem, Shamu. I'm happy to help.
\n**Shamu:** So, Ramu, I'm interested in learning more about ethical hacking. Do you have any recommendations for where I can start?
\n\n**Ramu:** Sure, Shamu. There are a few different ways you can learn about ethical hacking. One option is to take an online course or a workshop. There are a lot of resources available online that can teach you the basics of ethical hacking.
\n**Shamu:** Actually, I studied ethical hacking at Certisured, one of Bangalore's best institutes. They have great infrastructure, with state-of-the-art classrooms and a comprehensive curriculum. It's the top-rated choice for amateurs like myself who want to learn about ethical hacking.
\n\n**Ramu:** That sounds like a great place to learn. It's always a good idea to get hands-on training and practice in a classroom setting, rather than just learning online. And it's great to hear that Certisured has a strong reputation for their ethical hacking program.
\n**Shamu:** Yeah, it really is a top-notch institute. The instructors are all highly experienced and knowledgeable, and they do a great job of explaining the concepts in a way that's easy to understand. Plus, the hands-on exercises and projects really helped me to solidify my understanding of the material.
\n\n**Ramu:** That's great to hear, Shamu. It's always a good idea to get as much practical experience as possible when learning a new skill. It sounds like Certisured is a great place to learn about ethical hacking.\n","blog_slug":"hacking","published_date":"7 Jan 2023"}]},{"name_and_surname":"Prince Das","short_description":"Aspiring Digital Marketer @ Presidency University with the passion to rank number one in every google search.","twitter_url":"https://www.linkedin.com/in/prince-das-719b32213/","linkedin_url":"https://www.linkedin.com/in/prince-das-719b32213/","designation":" Digital Marketing Intern","image":{"localFile":{"childImageSharp":{"gatsbyImageData":{"layout":"constrained","backgroundColor":"#f8e848","images":{"fallback":{"src":"/static/c578e4625707c843fbc5e0be1bbba9b1/88414/Pics_Art_06_01_10_17_07_578f8ab825.png","srcSet":"/static/c578e4625707c843fbc5e0be1bbba9b1/67e37/Pics_Art_06_01_10_17_07_578f8ab825.png 636w,\n/static/c578e4625707c843fbc5e0be1bbba9b1/e3495/Pics_Art_06_01_10_17_07_578f8ab825.png 1272w,\n/static/c578e4625707c843fbc5e0be1bbba9b1/88414/Pics_Art_06_01_10_17_07_578f8ab825.png 2544w","sizes":"(min-width: 2544px) 2544px, 100vw"},"sources":[{"srcSet":"/static/c578e4625707c843fbc5e0be1bbba9b1/2ecb7/Pics_Art_06_01_10_17_07_578f8ab825.webp 636w,\n/static/c578e4625707c843fbc5e0be1bbba9b1/944a0/Pics_Art_06_01_10_17_07_578f8ab825.webp 1272w,\n/static/c578e4625707c843fbc5e0be1bbba9b1/633eb/Pics_Art_06_01_10_17_07_578f8ab825.webp 2544w","type":"image/webp","sizes":"(min-width: 2544px) 2544px, 100vw"}]},"width":2544,"height":2189}}}},"blogs":[{"title":"Don't let these errors derail your website's search engine optimization efforts","Descrption":"#### SEO, or search engine optimization, is a process used by businesses to increase their visibility in online search results. It is often pursued by those who wish to drive more website traffic through organic (i.e. unpaid) means. SEO can be a powerful tool when done correctly as it can help your website rank higher in search engine results pages (SERPs), increasing your visibility and driving more traffic to your site. It can also be damaging to a website when done incorrectly. Unfortunately, many beginners make common mistakes that can hurt their website's SEO efforts and compromise their visibility online.\n\n\n ## Here are the four most common SEO mistakes beginners make:\n\n1.\t**Overstuffing and utilizing the incorrect keywords.**\n\n\nKeywords are the most basic thing that search engines work on, so the temptation to stuff as many keywords as possible is strong. Experts usually recommend keeping keyword density between 4 and 7 percent and making them appear as natural as possible. If you're still not getting organic traffic to your site, you may be targeting the wrong keywords. Choosing the right keywords for your company or website is critical. You will not get any traffic if you focus on keywords that people do not search for on Google.\n\n2.\t**Disregarding alt text.** \n\nEven though image optimization is not as important as content optimization, neither should be overlooked. They frequently play a role in ranking tie-breakers, and you understand how important a single ranking is in terms of traffic! Google bots crawl into images after searching for them in content blocks, making them an important part of the content creation process. Although this will not count as organic common search traffic, proper image optimization will increase your site's chances of being found on Google images, and you should take visitors as they come and leave no stone unturned.\n\n\n\n3.\t**Not making your website mobile-friendly.**\n\nSEO is more than just writing content and obtaining backlinks. It's also about your website's overall quality, which includes speed, design, and, most importantly, mobile-friendliness. Google now gives mobile searches precedence over web searches. As a result, if your website isn't mobile-friendly, it may not rank well in Google searches – whether on mobile or desktop.\n\n\n\n4.\t**Not concentrating on local search!**\n\nAccording to Google, 76% of people who use their smartphone to conduct a local search visit a business within 24 hours, and 28% of those searches result in a purchase. Relevance, Distance, and Prominence are the three main factors used by Google to determine local rankings.\nHere are some suggestions to help you improve your local search:\n• Create a Google My Business account \n• Get regular reviews from satisfied customers \n• Optimize for voice search \n• Include local keywords in the content \n• Taking advantage of the location feature while posting on social media.\n\n5.\t**Is it your language or do you recycle?**\n\n\nIt is difficult to create new content. Producing meaningful, well-written content usually requires research, knowledge, and, most importantly, time. Some bloggers, unfortunately, take shortcuts. They either conceal other people's content outright or rewrite other authors' writings utilizing content-spinning tools. They believe that simply increasing the volume of content on their site will improve their chances of ranking on the first page. Google and other search engines use advanced algorithms to detect duplicate content. They don't like duplicated content, so if you use this strategy, you won't be able to attract organic traffic. Concentrate on producing original, high-quality content. One piece of useful, relevant content per week will be far more beneficial to your readers than 4-5 pieces of low-quality, copied content. \n\n\nThe importance of SEO in securing organic search engine traffic cannot be overstated. While there are plenty of SEO tips available online, it's common to make a few errors, especially when you're first getting started. \nYou'll have a strong foothold on increasing brand exposure via SERPs and generating clicks to your website if you avoid these most common SEO mistakes made by beginners.\n","blog_slug":"common-seo-mistakes","published_date":"MAY - 23"}]},{"name_and_surname":"Malkanagouda Patil","short_description":"Malkanagouda Patil is a data enthusiast and a content researcher. He works as a business analyst who works predominantly on deriving insights and intelligence using SQL, Power BI & Python Programming","twitter_url":null,"linkedin_url":"https://www.linkedin.com/in/malkanagouda-patil-996207248","designation":"Business Analyst & Content Researcher","image":{"localFile":{"childImageSharp":{"gatsbyImageData":{"layout":"constrained","backgroundColor":"#c8e8f8","images":{"fallback":{"src":"/static/46699e3dbc63895783bc9c5c79d15d28/5528a/Certisured_malkanagouda_6c76083ffd.jpg","srcSet":"/static/46699e3dbc63895783bc9c5c79d15d28/8ad59/Certisured_malkanagouda_6c76083ffd.jpg 310w,\n/static/46699e3dbc63895783bc9c5c79d15d28/a552f/Certisured_malkanagouda_6c76083ffd.jpg 620w,\n/static/46699e3dbc63895783bc9c5c79d15d28/5528a/Certisured_malkanagouda_6c76083ffd.jpg 1240w","sizes":"(min-width: 1240px) 1240px, 100vw"},"sources":[{"srcSet":"/static/46699e3dbc63895783bc9c5c79d15d28/8a129/Certisured_malkanagouda_6c76083ffd.webp 310w,\n/static/46699e3dbc63895783bc9c5c79d15d28/48455/Certisured_malkanagouda_6c76083ffd.webp 620w,\n/static/46699e3dbc63895783bc9c5c79d15d28/29621/Certisured_malkanagouda_6c76083ffd.webp 1240w","type":"image/webp","sizes":"(min-width: 1240px) 1240px, 100vw"}]},"width":1240,"height":1354}}}},"blogs":[{"title":"Data Modeling In Power BI","Descrption":"Hi, First most if you are learning power BI then one of the most **important and foundational skills** to learn is **Data Modelilng** and even will call power BI is a power full tool for data modelling so this skill is mandatory for those in data field like data analyst ,business analyst, data science etc.\n\t\n### **What is Data Modelling?**\nData Modelling is the process of organising your data tables and giving relation between them. Imagine or think of a blueprint of how the data fits together.\n\nIn Power BI, this happens in the **Model view**, where you can connect tables using keys (like CustomerID, ProductID, etc.).\n\n\n\nIn the data modelling in Power BI we have one best technique that is star schema \nAnd other techniques but star schema is a one technique which is a very useful technique in data warehousing and data modelling. Let's see what it is.
\n\n### **Star schema**\n\n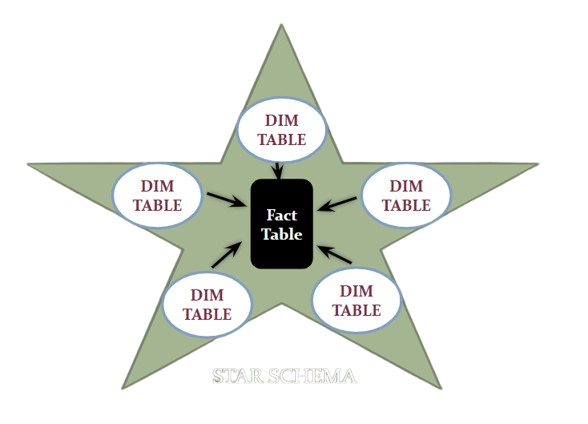\n\n### **What is a Star Schema? (The Real-World Explanation)**
\nImagine you're running a business, and you've got tons of data — sales, customers, products, dates, and more. But if all that data is just thrown into one big messy spreadsheet, good luck finding anything useful.\nSo, what do you do? You organise.
\nA **star schema** is a simple, smart way to structure your data so you can analyse it quickly and clearly — especially in tools like **Power BI, Excel**, or any business intelligence platform.
\nHere’s how it works:\n- **You have one big table in the middle:** This is your **fact table**. It holds all the action — things like sales, revenue, or quantity sold. It's mostly numbers and IDs.\n- **Around it are smaller supporting tables:** These are your **dimension tables**. They describe the “who,” “what,” “when,” and “where” of each transaction — like customer names, product details, dates, or store locations.\n\nIt’s called a **star** schema because if you draw lines between the fact table and the dimension tables, the shape looks like a star.\n\n\n\n### **Creating Relationships**
\nTo connect the tables:
\n1. Go to the **Model View** in Power BI.\n2. Drag and drop a column from one table to another (e.g., Sales.ProductID → Products.ProductID).\n3. Ensure it's **one-to-many** (1:*) relationship — dimensions should be on the \"one\" side.
\n\n### **Cardinality and Cross Filter Direction**
\nWhen building relationships, Power BI asks for:
\n- **Cardinality:** one-to-one, one-to-many, or many-to-many\n- **Cross Filter Direction:** single or both\n**Best Practices:**\n- Use a single **direction** unless you need both.\n- Keep **fact to dimension** relationships (not the other way).\n- Use a **date dimension** instead of relying on raw date fields.\n- Keep your model **simple** — avoid circular relationships.\n- Rename tables and columns to be user-friendly (no tbl_Cust — use Customers).\n- Create **calculated columns** or **measures** in DAX instead of loading too much data from source.\n\n**Conclusion:**\nGetting data models is half\t of the work in the power BI if your data model is well created means well prepared data with the relationship then the analysis will come easily and properly build a relationship between the fact and dimension tables that we call star schema technique. And power BI is a powerful tool for data modeling that means more options are given to create tables and give the relationship with different cardinalities.","blog_slug":"data-modeling-in-power-bi","published_date":"16th May 2025"},{"title":"Exploratory Data Analysis","Descrption":"## **Exploratory Data Analysis (EDA)**\n\nExploratory Data Analysis, or EDA, is the critical first step in any data science or analytics project. It’s where we begin to dig into the dataset—cleaning it up, making sense of it, and uncovering trends or patterns that might guide future analysis. Think of it as getting to know your data before diving into complex models or predictions.\n\nAt its core, EDA is about understanding your dataset—its structure, quality, distribution, and the relationships between variables.\n\n\n #### **Let’s walk through the main stages of EDA in a practical and intuitive way.**\n\n**1. Define the Objective \n2. Understand the Data \n3. Data Cleaning \n4. Univariate Analysis \n5. Bivariate / Multivariate Analysis \n6. Feature Engineering (optional) \n7. Detect Outliers \n8. Data Visualization \n9. Initial Hypothesis Testing (optional) \n10. Summarize Findings** \n\n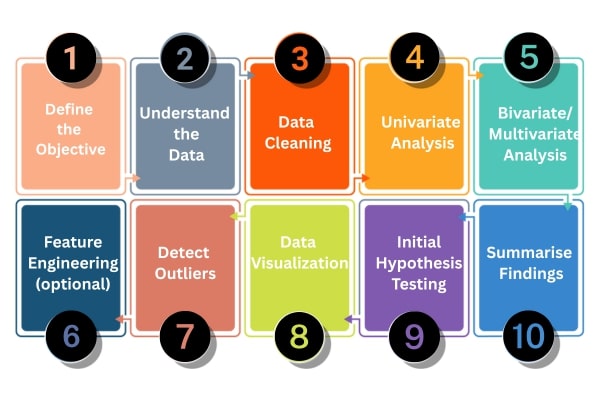\n\n\n\n### **1. Define the Objective**\nThis is the first step in the eda that includes clearly stating the purpose of analysis and in simple terms defining the objective means clarifying the **\"why\"** behind your data exploration. It's about pinpointing the **specific question you aim to answer** or the **particular problem you're trying to understand or solve** using the data.
\nThis first step is very important because it gives you a clear goal. Without knowing what you're trying to find, your analysis can become row and unhelpful. It's like asking a question or deciding what you're looking for before you start exploring the data.\n\n
\n\n### **2. Understand the Data**\nThis second step involves getting familiar with the dataset itself. You need to understand its structure, the meaning of each variable, the data types, and potential sources of the data.\nBasically this process will call Data profiling, data reading, data viewing, this includes things like what is the size of given data,shape of the data(how many rows and columns) and what are the columns and their information and what data type of each column in a simple way to review all about data. \n\n**Details in Brief:**\n- **Data Source:** Where did the data come from? (e.g., database, CSV file, API).\n- **Data Structure:** How is the data organized? (e.g., rows and columns, tables).\n- **Variables (Features):** What does each column represent? What are their units (if applicable)?\n- **Data Types:** What kind of data does each variable hold? (e.g., numerical, categorical, date/time).\n- **Sample Size:** How many data points (rows) are there?\n- **Initial Exploration:** Use functions like head(), tail(), info(), describe() to get a first look at the data.\n\n
\n\n### **3. Data Cleaning**\n Real-world data is often messy. This step involves identifying and handling issues that could affect your analysis. In a simple way raw data collected from domains would be incorrect and inoperable and possible reasons could be mistyping, corruption, duplication, missing values and so on. And the basic data cleaning has to be exercised before exercising any further steps of data pre-processing.\n\n**Details in Brief:**\n- **Missing Values:** Identify and decide how to handle missing data (e.g., imputation, removal).\n- **Duplicate Records:** Detect and remove any duplicate entries.\n- **Inconsistent Formatting:** Standardize data formats (e.g., date formats, text case).\n- **Incorrect Data Types:** Convert variables to the appropriate data types.\n- **Handling Special Characters or Errors:** Address any unusual or erroneous entries.\n\n
\n\n### **4. Univariate Analysis**\nUnivariate Analysis is all about analyzing a single variable at a time. It helps to understand the basic features of the data, like its distribution, central tendency, and spread.\n\n**Details in Brief:**\n- **Numerical Variables:** Calculate descriptive statistics (mean, median, mode, standard deviation, quartiles, range). Visualize the distribution using histograms, box plots, density plots.\n- **Categorical Variables:** Calculate frequency counts and percentages for each category. Visualize the distribution using bar charts or pie charts.\n- **Identify Potential Issues:** Look for unusual distributions, skewness, or potential outliers within individual variables.\n\n
\n\n### **5. Bivariate / Multivariate Analysis**\nThis step tells the relationships between two or more variables. The goal is to understand how variables interact with each other.\n\n**Details in Brief:**\n- **Numerical vs. Numerical:** Use scatter plots to visualize the relationship. Calculate correlation coefficients (e.g., Pearson, Spearman) to quantify the linear or monotonic relationship.\n- **Categorical vs. Categorical:** Use contingency tables (cross-tabulations) to examine the relationship. Perform chi-squared tests to assess independence. Visualize using stacked bar charts or grouped bar charts.\n- **Numerical vs. Categorical:** Compare the distribution of the numerical variable across different categories using box plots, violin plots, or by calculating summary statistics for each group. Perform t-tests or ANOVA to assess significant differences in means.\n- **Multivariate Analysis:** Explore relationships among more than two variables using techniques like pair plots, correlation matrices (heatmaps), or dimensionality reduction techniques (if needed for visualization).\n\n
\n\n### **6. Feature Engineering (Optional)**\n This step involves creating new features from existing ones to potentially improve the performance of a model or reveal hidden patterns. It's not always necessary but can be very valuable.\n\n**Details in Brief:**\n- **Creating Interaction Terms:** Combining two or more variables (e.g., multiplying them).\n- **Polynomial Features:** Creating higher-order terms of existing numerical features.\n- **Binning/Discretization:** Converting numerical variables into categorical bins.\n- **Encoding Categorical Variables:** Converting categorical variables into numerical representations (e.g., one-hot encoding, label encoding). \n- **Extracting Information:** Deriving new features from existing ones (e.g., extracting day of the week from a date variable).\n\n
\n\n### **7. Detect Outliers**\nOutliers are data points that significantly deviate from the rest of the data. Identifying and handling them is important as they can skew statistical analyses and model performance.\n\n**Details in Brief:**\n- **Visual Methods:** Use box plots, scatter plots to visually identify potential outliers.\n- **Statistical Methods:** Use techniques like the IQR method (Interquartile Range), Z-score, or DBSCAN algorithm to detect outliers based on statistical properties.\n- **Handling Outliers:** Decide how to treat outliers (e.g., removal, transformation, capping, or keeping them if they represent genuine extreme values).\n\n
\n\n### **8. Data Visualization**\nVisualizations are essential for understanding patterns, trends, and relationships in the data. They make complex information more accessible and help in communicating findings.\n\n**Details in Brief:**\n- **Choosing Appropriate Plots:** Select visualization techniques that are suitable for the type of data and the relationship you want to explore (e.g., histograms for distributions, scatter plots for correlations, bar charts for comparisons).\n- **Creating Clear and Informative Visuals:** Ensure plots have clear labels, titles, legends, and are easy to interpret.\n- **Exploring Different Perspectives:** Create multiple visualizations to look at the data from various angles.\n\n
\n\n### **9. Initial Hypothesis Testing (Optional)**\nBased on the initial observations and patterns, you might want to perform preliminary statistical tests to formally assess certain hypotheses.\n\n**Details in Brief:**\n- **Formulating Hypotheses:** State specific claims about the data that you want to test.\n- **Choosing Appropriate Tests:** Select statistical tests based on the type of data and the hypothesis being tested (e.g., t-tests for comparing means, chi-squared tests for independence).\n- **Interpreting Results:** Understand the p-values and make initial inferences about the hypotheses. This step can guide further, more formal statistical analysis.\n\n
\n\n### **10. Summarize Findings**\nAfter performing the analysis, it's crucial to synthesize your observations and insights into a clear and concise summary.\n\n**Details in Brief:**\n- **Key Patterns and Trends:** Highlight the most important relationships, distributions, and anomalies you discovered.\n- **Answering the Initial Objective:** Relate your findings back to the original question or problem you set out to address.\n- **Limitations of the Analysis:** Acknowledge any limitations in the data or the analysis performed.\n- **Recommendations or Next Steps:** Suggest potential further investigations, modeling approaches, or actions based on your findings.\n\n
\n\nOverall, the goal of EDA is to gain a better understanding of the data and to identify potential hypotheses or questions that can be further tested and explored. By using visualization and statistical analysis, you can better position yourself to make informed decisions and draw accurate conclusions about your data.\n","blog_slug":"exploratory-data-analysis","published_date":"8-May-2025"},{"title":"Tableau Career Opportunities: 5 Reasons to Learn Tableau","Descrption":"Tableau is a powerful data visualization and business intelligence tool that enables users to analyze and present data insights effectively. Its user-friendly interface, interactive visualizations, and real-time data analysis capabilities make it a valuable asset for data-driven decision-making. Tableau's extensive connectivity to various data sources, along with features like data blending and geospatial visualization, allows users to explore complex datasets and uncover valuable insights. Its versatility and widespread adoption across industries make Tableau a leading choice for professionals seeking to transform raw data into actionable knowledge.\n\nCareers in Tableau are highly sought-after. There is no better time than the present to seek Tableau certification and launch a career in business intelligence and data analytics, according to analysis of Google Trends data.\n\n**If you're unsure of why you should start studying Tableau, don't worry; we've got you covered with five excellent arguments!**\n\n1. In-Demand Skillset\n2. Versatility Across Industries\n3. Variety of Job Roles on Offer\n4. Future of Tableau Careers\n5. Seamless Data Exploration\n\n\n#### **1. In-Demand Skillset**\n Tableau's prominence as a data visualization and analytics tool has soared in today's data-driven environment, making it a highly sought-after skillset by enterprises everywhere. The capacity to evaluate and present data in a visually appealing way, which is essential for data-driven decision-making, is a skill that professionals acquire by mastering Tableau. As businesses look to harness the power of data to achieve a competitive edge, there is an increase in demand for Tableau specialists. Learning Tableau increases your employability and positions you as a valuable asset in the job market, opening up a wide range of professional prospects across different industries. A meaningful profession where you can contribute significantly to turning unstructured data into useful insights and accelerating corporate performance is made possible by embracing Tableau.\n\n#### **2. Versatility Across Industries**\nTableau's versatility is evident in its widespread adoption by top companies across various industries. In finance, companies like JPMorgan Chase, Citigroup, and Goldman Sachs use Tableau to analyze financial data, monitor market trends, and optimize investment strategies. In healthcare, organizations like Johnson & Johnson, Pfizer, and Mayo Clinic leverage Tableau for patient data analysis, medical research, and healthcare service optimization. The technology sector also relies on Tableau, with companies like Microsoft, Cisco, and Adobe using it for business intelligence, customer analytics, and product performance analysis. Retail giants Walmart, Amazon, and Target gain valuable insights into consumer behavior and optimize supply chain operations using Tableau. Moreover, entertainment industry leaders Netflix, Disney, and Warner Bros. depend on Tableau to analyze viewership data, optimize content recommendations, and drive marketing strategies. Tableau's presence even extends to government organizations, where entities like NASA, the U.S. Department of Defense, and the Federal Reserve utilize it for data-driven decision-making. This extensive adoption across diverse industries solidifies Tableau's position as a powerful tool for data visualization and analysis, making it an essential skillset for professionals seeking to excel in the data-driven world.\n\n#### **3. Variety of Job Roles on Offer**\nThe nice part about Tableau jobs is that you may select from a wide range of employment responsibilities and at different stages of your career. The following list of popular job titles for Tableau specialists.\n\n- **Data analyst:** To explore and analyze data, produce visuals, and glean insights to assist corporate decision-making, data analysts utilize Tableau.\n- **Business Intelligence Analyst (BI Analyst):** BI analysts use Tableau to build dynamic dashboards and reports that let users extract insightful information from data.\n- **Data visualization specialist:** To create aesthetically appealing and powerful data visualizations, visualization professionals make advantage of Tableau's sophisticated capabilities.\n- **Data Scientist:** To analyze and visualize large, complicated datasets, find trends, and create prediction models, data scientists utilize Tableau.\n- **Business Analyst:** corporate analysts use Tableau to evaluate business data and trends, offering insightful information that helps to advance corporate operations and plans.\n- **Data Engineer:** For smooth data analysis and visualization, data engineers integrate data from numerous sources into Tableau.\n- **Data Storyteller:** Data storytellers utilize Tableau to build engrossing narratives out of data and successfully share findings with various audiences.\n- **Data Consultant:** Clients receive assistance from data consultants using Tableau for data analysis, visualization, and the implementation of data-driven initiatives.\n- **Marketing Analyst:** To improve marketing tactics, marketing analysts utilize Tableau to evaluate data from marketing campaigns, consumer behavior, and ROI.\n- **Financial Analyst:** To analyze financial data, create budgets, and predict financial patterns, financial analysts use Tableau.\n- **Operations Analyst:** To evaluate operational data, spot inefficiencies, and enhance procedures, operations analysts utilize Tableau.\n- **Healthcare Analyst:** To evaluate patient data, healthcare trends, and improve healthcare services, healthcare analysts utilize Tableau.\n- **supply chain Analyst:** To evaluate data from the supply chain, keep track of inventories, and improve logistics.\n\nTableau's versatility allows professionals from various domains to use it as a powerful tool for data analysis and visualization, making it a valuable skillset across a broad spectrum of job roles. Whether you're interested in data analysis, business intelligence, marketing, finance, or any other field, Tableau skills can open doors to exciting and diverse career opportunities.\n\n#### **4. Future of Tableau Careers**\n As businesses depend more and more on data-driven insights, Tableau specialists will be essential in turning raw data into useful intelligence. Tableau specialists have a tremendous opportunity to change the data analytics environment in the future.\n\n\n\nSo what are you waiting for? Many Business Intelligence professionals have already realized this trend and have been busy mastering Tableau to up-skill themselves. Don’t fall behind; learn Tableau to get on the data visualization bandwagon now!\n\n\n#### **5. Seamless data exploration**\n\n\n\nThe key feature of Tableau that enables users to easily access and analyze data is seamless data exploration. Users can build meaningful dashboards and reports fast using Tableau because to its user-friendly interface and interactive visualizations. Users may quickly filter and sort data, drill down into specifics for more in-depth research, and drag and drop data fields to generate visualizations. Due to the constant updating of the data due to the real-time data connection, correct and pertinent insights are provided. Users are empowered to make data-driven decisions more quickly, see trends, and find hidden patterns thanks to this fluid data exploration, which also improves performance. Tableau is a powerful tool for acquiring insightful information and making decisions, whether you are a data analyst, business user, or executive.\n\n### Conclusion:\nLearning Tableau opens up a world of opportunities, as it offers an in-demand skillset, versatility across industries, and a diverse range of job roles. The future of Tableau careers is promising, with seamless data exploration capabilities paving the way for impactful data-driven insights. Embrace Tableau today, and embark on a fulfilling journey of data visualization and analytics excellence.","blog_slug":"tableau-career-opportunities-5-reasons-to-learn-tableau","published_date":"09 August 2023"},{"title":"Choosing Your Data Dance: ETL vs. ELT ","Descrption":"### **ETL**\n\nETL stands for **Extract, Transform, Load**, and it refers to a process in data integration and data warehousing. Each step in the ETL process plays a crucial role in moving and preparing data for analysis.\n\n**Extract:**
\n In this phase, data is gathered from various sources, such as databases, flat files, APIs, or other systems. The goal is to pull the relevant data from these sources for further processing.\n\n**Transform:**
Once the data is extracted, it undergoes a transformation process. This involves cleaning, structuring, and converting the data into a format that is suitable for analysis and reporting. Transformation may include filtering out unnecessary information, handling missing data, and converting data types.\n\n**Load:**
After the data has been extracted and transformed, it is loaded into a target database or data warehouse. The destination could be a relational database, a data lake, a data mart, or any other storage system designed to support reporting and analysis.\n\n### **ELT**\n\nELT stands for **Extract, Load, Transform**, which is an alternative approach to data integration and processing compared to ETL (Extract, Transform, Load). In ELT, the transformation of data occurs after the data has been loaded into the target system, typically a data warehouse.\n\n**Extract:**
Data is extracted from source systems, such as databases, applications, or other data repositories. The raw data is then moved to the target system without significant transformation.\n\n**Load:**
The extracted data is loaded into a target system, usually a data warehouse or a big data platform. This process involves moving large volumes of raw data into a storage environment where it can be efficiently managed and queried.\n\n**Transform:**
After the data is loaded into the target system, transformations, and processing are applied within the target environment. This can involve cleaning, structuring, and organizing the data to make it suitable for analysis. Transformations may include aggregations, joins, and other data manipulations.\n\n### **Difference Between ETL and ELT**\n\n\n \n
\n\n\n### **Unveiling Variances: ETL vs. ELT Processes Explained**\n\n### ***ETL Process:***\n\n**Extract:** Get data from different sources.\n\n**Transform:** Change and organize the data using another server.\n\n**Load:** Put the transformed data into a destination database.\n\n\nIn ETL, data gets transformed before moving it to the target database.\n\n\n### ***ELT Process:***\n\n**Extract:** Take data from various sources.\n\n**Load:** Put the data as it is into a data warehouse or data lake.\n\n**Transform:** Make necessary changes to the data inside the target system.\n\nWith ELT, all the cleaning and changes to the data happen within the data warehouse. You can work with and modify the raw data multiple times.\n\n**History:**\n\n- **ETL:** Been around since the 1970s, widely used with data warehouses. But, it needed custom processes for each data source.\n- **ELT:** Became popular with cloud technologies. Companies can store a lot of raw data and analyze it later. ELT is the modern way for effective analytics.\n\n### **Conclusion**\nIn the data dance, picking ETL or ELT is like choosing dance steps. ETL transforms data before putting it away, while ELT loads raw data and transforms it later. ELT is quicker, uses the warehouse's resources, and can handle different data types. So, choose your data dance wisely for smooth insights and business goals.\n \n\n\n\n\n\n\n\n\n\n","blog_slug":"ETL-ELT","published_date":"Dec 25th"}]},{"name_and_surname":"Mannat Soni","short_description":"Mannat is a computer science engineer from Panjab university. She is passionate about Data Science, Machine Learning and Creative scientific writing. ","twitter_url":"https://www.linkedin.com/in/mannat-soni-b5ba54175/","linkedin_url":"https://www.linkedin.com/in/mannat-soni-b5ba54175/","designation":"Science Blogger and Content Creator, certisured.com","image":{"localFile":{"childImageSharp":{"gatsbyImageData":{"layout":"constrained","backgroundColor":"#c8c8a8","images":{"fallback":{"src":"/static/328741afb4c81d1ac30ab20706879819/202f5/12_f931cf42c7.webp","srcSet":"/static/328741afb4c81d1ac30ab20706879819/c6b8d/12_f931cf42c7.webp 80w,\n/static/328741afb4c81d1ac30ab20706879819/3883e/12_f931cf42c7.webp 160w,\n/static/328741afb4c81d1ac30ab20706879819/202f5/12_f931cf42c7.webp 320w","sizes":"(min-width: 320px) 320px, 100vw"},"sources":[]},"width":320,"height":400}}}},"blogs":[{"title":"Outliers are not liars: they have a significance in peripheral vision for business leaders","Descrption":"Kindly ignore the outliers created due to experimental errors while reading this article.\n\n*“Just because I haven’t found my distribution yet, am I an Outlier?”*\n\nWise men say life is like Math; most problems have mathematical solutions, but, if all data points lie on your regression line, then something is not well. Every aspect of life experiences outliers. They live-in extremes showcasing both negative and positive possibilities.\nBut our rudimentary action with them has been of complete discrimination and discard.\n\n**Why?**\n\n\n**There is this concept called King and Pauper effect.**\n\nAs per Wikipedia, in statistics, economics, and econo-physics the King effect refers to the phenomenon where the top one or two members of a ranked set show up as outliers. These top one or two members are unexpectedly large because they do not conform to the statistical distribution or rank-distribution which the remainder of the set obeys. Likewise, the Pauper Effect is understood as the observations in the lower ranks.\nTherefore, traditional understanding permeates outliers to be abnormal, indicating their importance with respect to normal or the mean of the distribution. \nI still wonder, why have we not been able to look at it as something “Outside the box”?\nBefore we delve deeper into that concept, let us first explore the idea of an Outlier. Fragmenting it, piece by piece should give us a profounder perspective.\n\nO.U.T.L.I.E.R\nSomething that lives outside? or Something that lies, outside?\n\nEvery data scientist would define an outlier as a data point or a value that lies in a data series or any distribution on its extremes, which is either very small or very large and therefore may impact the overall observation made from the data series. Outliers are also explained as extremes because they lie on the either end of a data series. \n\nOutlier observations lie at abnormal distances from other values in a random sample from a population. Outliers are usually treated as abnormal values as they do not conform to the normal and ipso facto affect the overall observation of the process by pulling the central tendencies towards the extremes due to their very high or low extreme values.\n\n**Outliers differ from other data points and observations significantly. They are thus discarded from the data series.**\n\nThis is where my argument begins. We discard outliers because they are potentially so influential that they would shift the mean from its original line of action. Instead, can they actually show us the extremes to which a situation is bound to perform?\nLet me ask you a question.\nWould you consider an earthquake an outlier as it is not supposed to be an “average” event? Or maybe, Einstein was an outlier because his IQ was totally not around the average IQ of a human being? \n\nIf you do, would you want to remove such events because they don’t serve the “average” data?\nIf yes, when will we rise from such mediocrity? \nThe vision that I carry speaks for itself. It is not for those who want to complete everyday tasks. It is for those who want to build an enterprise. \n\n> The point is, an outlier screams its values out to tell you the positive or negative potential an event carry. Whether we maximize on it or remove it due to the volatility it causes, is now in our hands.\n\nOutliers are not liars instead they have a future value: Not all outliers are false values. They may not be attributed to accidents, incidents and coincident of statistical studies. Outliers in distributions may even occur without random chance, accident, coincidence or incidence in sampling and data collection errors and experimental mistakes. They may be actual data point observations so what that they are lying at extreme distances from central tendencies and inter quartile ranges. It is in such cases that apt judgment and interpretation techniques of business leaders come to play the role.\nWhile managers are able to see everything that is visible to normal eyes and their comfort generally conforms to the trend, it is for the astute leaders to pick up these observations and respect them for what they reflect.\nIf these are actual occurrences with in a process distribution than they not only indicate possibility realm of a process but also highlight the way points along which future contours of the process may shape up or are shaping up.\nThus, while outliers are excluded from regression models, but they should not be ignored from leader’s cognition as they do show the future feasibilities. \n\n**Today’s outliers may be tomorrow’s central tendencies.**\n\nAlso, they show that the process under study has the potential to generate such outcomes, however good, bad or ugly they may be. Outliers should not be discarded totally. They have a story encased within them which needs to be decoded in detail.\nOutliers, therefore indicate that there are areas of distribution where a certain theory, belief or status quo wisdom might not be valid. There is something more to explore and leveraged. \nOutliers may have been thus spawned by flaws in the existing theory that otherwise generated an assumed family of probability distributions, resulting in some observations being far from the central tendencies of the data. \nSince outliers manifest that the population has a heavy-tailed distribution, tails cannot be cut for simplicity of data building. Outlier analysis may stimulate the paradigm shift in the process management. \n\n**However, it is for leaders to perceive what is normal.**\n\nIt is thus for analysts to decide what is normal or abnormal. \n\nBut one conviction is definitely there that normal for managers and leaders cannot be same. Leaders with the depth of vision and being able to perceive the invisible possibility frontiers can exploit these outlier observations in building futures and crafting tomorrows for their businesses. Outliers are signposts of future of the process under research. They are beacons of invisible spectrum and opportunities or challenges that are presently lying outside the normal process range but may occur in times to come. They are thus golden nuggets of peripheral vision a very important quality of leadership in industry. \nMajority data points indicate the present state of the process, but outliers indicate the future shape that the process can undertake in both positive and negative sense. Outliers can help in designing future strategies within the business either to accelerate the positive possibilities or requisite interventions to pre-empt negative pitfalls. \n\n**The soul of this blog lies in the argument that outliers have a story couched in them, decode if you can!**\n\n\n\n\n","blog_slug":"decoding-the-outliers","published_date":"Nov 22nd 2021"},{"title":"Quantum Computers : Will they replace the classical ones?","Descrption":"## QUANTUM COMPUTING\n\nLearning about quantum computing. Wow, what a classic, oh sorry, quantum idea!\n\n\n**No** they are not the same, and **no** they are not replaceable!\nDid you always think quantum is the better version of classic? Let’s explore! \n\nBefore we dive in into depths of the unknown, let me first give you a heads-up, as beginners, where we actually stand. \n\nHere is the roadmap or as I should say spin map of my quantum journey.\n\n\n\n\n#### My physics teacher once said, quantum computers will make very bad community leaders, never elect them, because they are never totally sure what values they hold!\n\n#### Wait for it!\n\n\nNow by the time it was 1981, Quantum theory had matured. Computer science was evolving. Computers were being used extensively for physical computations and were doing pretty good under the record. Then where was the need of quantum computers felt?\nWhy and how did it all begin?\n\n**HISTORY CLASS 101** | *Timeline 1982*\n\nSo back in the old days, whenever a scientist would want to review an experiment or would want to rerun to find better and polished results, thier go-to buddy was a classic computer. But processes that involved huge computations became slow and inefficient to perform. \nThat’s when Feynman introduced the idea as to why do physicists need computers that can perform computation exponentially!\n\nSo he placed the following questions on the table:\n1.\tCan classical physics be simulated by a classical computer?\n2.\tCan quantum physics be simulated by a quantum computer?\n3.\tCan physics be simulated by a quantum computer?\n4.\tCan a quantum simulation be universal?\n\n*Timeline 1985*\n\nThe next step was “Quantum Turing Machine”. He brought the concept of Quantum parallelism based on superposition principle. He proposed that QTM can encode many inputs on the same tape and perform the calculations simultaneously.\n\n> Just so that you don’t lose me here:\n\n - Quantum Turing Machine- A simple model to capture quantum computation.\n - Quantum Parallelism- It is a consequence of superposition that discusses the resulting increase in the computational speed exponentially than linearly\n\n (like in classical computers).\nHe brought the idea that the inefficiency of classical computers could be overcome by quantum computers?\nHad we found a replacement of classical computers? No more 1’s and 0’s?\n\n\n*Timeline 1994*\n\nIt was time for the master minds to put that bulky organ on top to some good use. And then we had our very first quantum algorithm. By exploring the power of quantum parallelism Peter Shor figured out an algorithm for quantum computers to find out prime factorization beating the time taken on classical computer exponentially.\n\n*Timeline 1996*\n\nThen we had another ground-breaking algorithm written by Grover that was capable of searching a single item in an unsorted database in square root of a time it would take on a classical computer.\nSince searching in database and prime factorization are central themes in Computer science, Shor and Grover’s work brought intense simulation to the world of Quantum computers. It made them extremely exciting and they started growing rapidly.\nAnd that’s how quantum computers became the new thing of the generation. \n\nNow we know who brought the idea & we know what algorithms gave it their first break.\n\n**But what actually is Quantum Computing?**\n\nIf I were to express it poetically...\n\n> Quantum theory fell in love with computer science.\n\nAnd as they say, extraordinary love changes the world; quantum computation was born.\nAccording to Wikipedia, quantum computing is the use of quantum mechanical phenomena such as super positions and entanglement (*we will talk about them in a bit*), to perform computation. The computers that perform quantum computations are called quantum computers.\nQuantum mechanics involve quantum particles and they work by controlling the behavior of these particles.\n\n**On what principles does this magic happen?**\n\nThe basic principles of quantum computing is the same as that of quantum theory.\n\n**SUPERPOSITION+ENTANGLEMENT**\n\nSuperposition: Superposition is a way to describe the movement of particles when it has no real world equivalence. All particles exist in the superposition until they are measured. They can be anywhere anytime. \n\nEntanglement: It is a phenomena in which quantum entities are created and/or manipulated such that none of them can be described without referencing it to the other. Individual entities are lost. \n\nThe process involves entanglement of qubits and probabilities with superposition to carry out certain series of operations in order to find the result.\n\nBrace yourself because I am sure you can feel things slipping out of your hands.\n\nI can here your inner voice scream , \"what on earth are qubits now\"?\n\n**Think with me now.**\n\nThe ones who are familiar with the world of computers out of interest or because you are simply doing computer science / engineering would know that a classical computer works on two binary inputs, 0’s and 1’s called bits.\nOur old pals!\n\nBut a quantum computer does it using quantum bits, or as we all call it “Qubits”. A Qubit can be 0, or 1, or 0 and 1 at the same time. It has more fluid, non-binary identity.\n\nThis is what gives quantum computing its superior computing power.\n\n**What are qubits made of?**\n\nThey are usually electrons, photons or nucleus. We shall consider outer most electron of phosphorous as our qubit.\nBecause of the spin of the electron, it causes a magnetic field. This makes them tiny bar magnets which allows them to align in a magnetic field.\n\nNow when this alignment is in its lowest state we call it a 0 and to bring it to its highest state i.e. 1, we apply some external force.\n\nThey are special, they can exist in dual states at one time. That is, when we measure it, it can be in up or down position. \nBut before we measure, it will exist in the so called “quantum superposition”.\n\nQuantum superposition arises because at the quantum scale, particles behave like waves. Similar to the way that multiple waves can overlap each other to form a single new wave, quantum particles can exist in multiple overlapping states at the same time giving them multiple positions.\n\n\n\n\nQubits exists with some probability of being 0 and some of being 1. These constants indicate the relative probabilities of finding the electron in one state or the other.\nAs we all know interaction is the rule of nature. For anything to exist, it has to interact.\nHence, it’s hard to imagine the incredible power of quantum computing into action without interaction of two quantum bits. That’s where entanglement comes into picture. This leads to the information traveling faster than the speed of light. This happens because measurement on one member of the entangled pair will immediately determine measurement on the other. But it’s not that simple. \n\nAlthough the qubits can exist in any combination of states, when they are measured they must fall into one of the bases state. The states that are measurable. And all the information of the state before measuring it, is lost.\nSo as a result we do not desire a very complicated, unmeasurable superposition state. \nThe idea is to design the logic operations which we need to get to the final computational results in such a way that the final result is measurable. The important part is that these gates have to be reversible. This helps us in knowing the inputs when we know the outputs. This helps us in not losing the important data while processing. We need to do this because we need to keep the quantum computers in a state of superposition long enough to explore all the possibilities to arrive at a final answers. \n\nThe possibilities of qubits existing through probabilities gives us more number of steps to perform an operation. \n\n> It is not about every operation performed, it is about number of operations performed. \n\nIn quantum computing, the number drops exponentially. Thus giving us a revelation! \n\n*This brings us back to our very first question, are quantum computers a replacement for classical computers?* **No!**\n\nThis is because Quantum computers are not universally faster. They are only faster for particular operations where we can use computational analysis. There are many computations that a classical computer would perform better than a quantum one. Which is why it is not a replacement of a classic computer.\n\nHas Quantum computation confused you? If it has it means you are getting it.\n\n**What now?**\n\nEvery idea has a future.\n\nQuantum computer has a potential still unknown. So what does the future hold for us?\n\n1.\tPrivate Keys- These can be used to encrypt private messages going from one location to another. Because of so many possible patterns of qubits and quantum uncertainty hackers won’t be able to trace exact keys without breaking the quantum rules. Quantum encryption is the new future for cyber security.\n2.\tHealth and Medicine- Analyzing and developing drugs has always been the challenging tasks. Describing all of the quantum properties of each and every molecule in this world is a computational task way beyond the scope of any computer. \nBut since QC works on these principles, we will be able to align possibilities and find cures for many harmful and incurable diseases. \n3.\tTeleportation of information- Entanglement allows us to transfer information way faster. Thus without actually sending the information we might be able to exchange it in the near future thus saving so much of duplicate and unwanted data. \n\nIntroduction of quantum computation has opened a lot of domains for future discoveries. We need to understand that quantum computation has opened the doors of having multiple future for each moment. Because of quantum mechanics, we could possibly have infinite presents, Infinite universes, infinite possibilities.\n\nWe humans, with our great imagination and inquisitiveness have the capability to discover the unknowns.\nLet the future of quantum computation bring more possibilities to life. Let this be a way for us to reach to corners of the universe still hidden from us.\nNature has always been beyond the scope of human brains.\nThe future is fundamentally uncertain and to me, that’s certainly exciting.\n\n\n","blog_slug":"will-quantum-computers-replace-our-computers","published_date":"Oct 19th 2021"},{"title":"DEVELOPING PSYCHOLOGY OF COMPUTERS: WILL ARTIFICIAL INTELLIGENCE YIELD THE MACHINE ITS SIMULATED MIND?","Descrption":"**Human mind and cognition:** Psychology in Social Sciences is the study of the mind and behaviour of human beings. Its subject matter is how and why do humans behave the way they do or how do humans make sense of things in the world? Why do some actors be it individuals, groups, institutions or even nation-states; take decisions in a certain way? What is the judgmental and decision-making process that goes on in the backend? These are complex but critical questions that need to be understood. Thus, psychologists’ study perceptual processes, cognition, memory, linguistics, knowledge representation in the brain, consciousness, interpretation, judgments, decision making etc. They study the way information is processed in the brain. Psychology is divided into numerous specializations with cognitive psychology and cognitive science as emerging domains. One of the game-changing theories in psychology pertains to the Gestalt school of Psychology which postulates that the whole is bigger than the sum of its parts. In simple terms, it means that the image on the retina (sensory input) is not equal to the perceptual whole that is created in the mind. It can be less or more or even far more. The mind has the proclivity to fill gaps and create a meaning that is far more than sensory inputs. The number of stimuli gathered by senses and the way mind works are not linearly correlated. Also, each of the many billion humans on the planet have a distinct and special personality. Each human is different. While genetic codes do transfer through generations, yet no two human beings are identical. Further, human senses have limitations of what can be received by them. For example, human eyes and ears can receive inputs with respect to certain wavelengths and frequency only or they can discriminate between movement and stationery only if the objects are moving faster than particular frames per second. All these are anthropic limitations and we are designed that way. The observational selection effect is another aspect in meaning creation and knowledge reproduction. All these processes seamlessly operate in the human mind to yield meaning to external stimuli. Today’s neo-cortex is an evolutionary outcome of last 70,000 years .\n\n**Humanistic vs Mechanistic Mindsets:** Analyzing these thoughts by their extrapolation in artificial intelligence and machine learning (AI & ML) environment; AI & ML engineers would need to understand how human brain works and more importantly how their mind functions. While computing power is growing exponentially; yet it is a very complex task to replicate human mind. We can say that each human is running a different algorithm which is a result of unlimited factors. Human’s behavior is guided by moods, feelings, emotions and personality traits. To incorporate all these into AI, it will take lot of imagination, innovation and very deep understanding. While it is true that many computers be at Alpha Zero or AlphaGo have displayed stupendous success by beating and outperforming the opponent, yet it does not establish that these can outperform these personalities in all other activities also.12 May 1997 was a landmark day when paradigm shift in artificial intelligence was formally captured after a very long AI winter. On this day IBM’s Deep Blue supercomputer defeated Kasparov . A lot has happened from days of DEEPBLUE of IBM to DEEPMIND of GOOGLE. While AI is progressing leaps and bounds as demonstrated by Boston’s ATLAS programme, but to take it to other extreme of argument that is we are actually already living in a simulation as given by Nick Bostrom , is something that this blog intends to opinionate on. This argument hypothesizes a very high possibility of we all living in a simulation already. AI evolution in its present form is based on specific applications. But to claim that eventually humans will be replaced from even decision-making processes may be a far-fetched thought as yet. While all facts were fiction before and facts eventually may also be proven falsified, as a budding data scientist, via this blog I only wish to highlight that there is a significant difference between humanistic thinking and cognition based on AI & ML. \n\n\n\n**Clash of logics**: My next argument in this regard is based on the fact that humans and machines are logically different set ups. Humans work on abductive and inductive logics while computers can only work on deductive logics. Humans do not worry about structural validation or so-called syntactical validation, instead they focus on semantic validity. While this is a no go for machines. Is it therefore a clash of logics? Humans work on interpretative aspects gleaned from socio political and economic environment. But computers have no environment of this sort. While as per Aristotle, ‘Man is a social animal ’; but as per Thomas Hobbes, ‘People are inherently wicked and selfish ’. To incorporate these traits and create a social world for machines may be very complex and unfathomable task. Humans have relations, acquaintances, friends, enemies etc. Humans work on second level discourse albeit fallaciously yet machines function on formal logic or predicate logic . Thus, there is gap between human’s informal logic and machine’s first order logic. For machines to achieve all these aspects may be a science fiction as of now as depicted in Hollywood movie MATRIX. \n\n**Time speculation**: All in all, what future holds for us as part of AI is still a distant scenario, but AI has a huge role in making human life better, happier and more fulfilling. AI can support humans but speculations that super computing power may lead to development of machines that may make humans as their slaves may be an imaginary scenario whose implementation is nay impossible as demonstrated by reasoning given in the body of this blog. A debate on self-driven cars is an example in this regard. In case of an accident who will be responsible, auto pilot, computer engineer who wrote the algorithm, mechanical engineer who manufacture the self-driven car or the factory owner or the car owner. Thus, artificial intelligence and artificial humans are a way apart. AI will be evolving rapidly but artificial mind will only be created after sometime. It has taken 70,000 years for present state of human mind to evolve, I think we will have to give reasonable time for AI systems to mature and work like humans. Speculations that these are likely to happen in next a few decades or by the turn of this century may need more consideration. \n\n**Computation vs Consciousness:** A biological cell can fire at a speed in hertz, but an artificial neuron fires at GHz plus. Such is the disparity in computational power between humans and machines. Humans can never match the computational speeds and scales of computers. One understanding of consciousness is in terms of computation i.e., consciousness relates to several operations occurring in the human system at a given time. Psychologists define consciousness as a state of being aware of surroundings and inner self. Large number of stimuli hit human senses at a given time. But only selected a few are perceived while balance is rejected. Consciousness is best understood by its hindi translation which is ‘chetan’ or ‘chetna’. This word is a derivative of the Hindi word ‘chitt’ which means ‘mind’. So conscious is a person whose mind is operational. This is much more and far beyond the mere understanding of computation. \n\n**Conclusion: ** Artificial intelligence is revolutionizing the way humans’ function and human life operates. AI has tremendous benefits for mankind. However, naysayers and doomsday predictors have a perspective which would need to be not discounted. It is with those concerns accounted for that AI can truly serve the humanity and the life on mother earth. AI needs to be leveraged into all aspects of life so that human sufferings can be minimized and their quality of life, standard of living, happiness and overall, well-being may be enhance substantially.\n\nReferences:\nPicture Credits: https://www.quantamagazine.org/brain-computer-interfaces-show-that-neural-networks-learn-by-recycling-20180327/\n1. Stephan. De Spiegeleire, , Matthijs Maas and Tim Sweijs, “Artificial Intelligence and the Future of Defense”, The Hague Centre for Strategic Studies, 2017. P. 20. Available at https://hcss.nl/sites/default/ files/files/reports/Artificial%20Intelligence%20and%20the%20Future%20of%20Defense.pdf. Accessed on 10 July 2020\n2. http://www.theguardian.com/technology/2017/dec/07/alphazero-google-deepmind-ai-beats-champion-program-teaching-itself-to-play-four-hours accessed on 26 January 2020.\n3. https://www.google.com/search?q=man+is+a+social+animal&sxsrf=AOaemvL29rwp5sQUpFUbqjGgAbXODMcHwA%3A1636300172810&source=hp&ei=jPWHYYOwL-vD5OUPpcmpQA&iflsig=ALs-wAMAAAAAYYgDnMluubY6tx7aFgBv6YSTQWVuJuDz&oq=man+is+a&gs_lcp=Cgdnd3Mtd2l6EAEYADIFCAAQgAQyBQgAEIAEMgUIABCABDIFCAAQgAQyBQgAEIAEMgUIABCABDIFCAAQgAQyBQgAEIAEMgUIABCABDIFCAAQgAQ6BwgjEOoCECc6BAgjECc6BQgAEJECOg4ILhCABBCxAxDHARDRAzoICAAQgAQQsQM6DgguEIAEELEDEMcBEKMCOgsIABCABBCxAxCDAToLCC4QgAQQsQMQgwE6CggAELEDEIMBEAo6BQguEIAEOggILhCABBCxAzoICAAQsQMQgwE6BwguEIAEEAo6CgguEIAEELEDEAo6CwguEIAEEMcBEK8BUP8JWNwWYOUuaAFwAHgAgAGzAYgBrwmSAQMwLjiYAQCgAQGwAQo&sclient=gws-wiz accessed on 07 November 2021\n4. Nick Bostrom, “Are We Living In A Simulation”, Philosophy Quarterly (2003) Vol. 53. No. 211, pp. 243-255. (First Version: 2001) \n5. https://www.google.com/search?q=man+is+a+selfish+by+nature&sxsrf=AOaemvKpwAiOmjiwmRenJ6Mtr3Heb3H0aQ%3A1636300475683&ei=u_aHYY-MKaWe4-EPpYOkmAw&oq=man+is+a+selfish+by+nature&gs_lcp=Cgdnd3Mtd2l6EAMyBggAEBYQHjoHCAAQRxCwAzoECCMQJzoFCAAQzQJKBAhBGABQ2SVYo0Ngp0toAnACeACAAdQBiAHLDJIBBTAuOS4xmAEAoAEByAEIwAEB&sclient=gws-wiz&ved=0ahUKEwjP1eSkzob0AhUlzzgGHaUBCcMQ4dUDCA4&uact=5. Accessed on 07 November 2021\n6. https://www.google.com/search?q=predicate+logic+meaning&sxsrf=AOaemvJNcpAnNlsQIBo8xWzKPyh9pEfskw%3A1636301545376&ei=6fqHYeaxFs7brQHfwaygAQ&oq=predicate+lo+meaning&gs_lcp=Cgdnd3Mtd2l6EAEYADIGCAAQBxAeMgYIABAHEB4yBggAEAcQHjIICAAQCBAHEB4yCAgAEAcQBRAeMggIABAHEAUQHjIICAAQBxAFEB46BwgAEEcQsAM6BwgAELADEEM6BwgAELEDEEM6CwgAEAcQHhBGEPkBOgoIABCABBBGEP8BOggIABCABBCxAzoFCAAQgARKBAhBGABQ6gZYvjpgxE9oAXACeACAAe8BiAHiDpIBBjAuMTEuMZgBAKABAcgBCsABAQ&sclient=gws-wiz. Accessed on 07 November 2021\n","blog_slug":"developing-psychology-of-computers-will-artificial-intelligence-yield-the-machine-its-simulated-mind","published_date":"Feb 11, 2022"},{"title":"India’s Union Budget 2022-2023: India towards Digitization","Descrption":"India this August 2022 will complete its 75 years of Independence. In the journey of the next 25 years, India is preparing itself towards a digitized world and The Union Budget of the Financial year 2022-2023 reflects upon the same. While emphasizing especially on making India digital, Finance Minister Nirmala Sitharaman, reading her speech from a ‘Made in India’ tablet for the second consecutive financial year, noted our country’s unshakable efforts towards the recovery of the economy. With a reassuring growth of 9.2%, India is all set from setting up 75 digital banking units in 75 districts to bringing 5G with setting fibre optic cables all over rural India.\n\nIndia will enter another fiscal deficit with currently being at 6.9%, expected to go down to 6.4% this year with a target of reaching 4% by 2025. This new budget feels like a breath of fresh air. The Indian government has taken an initiative towards the development of emerging sectors like fintech, digital currency to boost the digital economy as being the primary goal to attain in the ‘Amrit Kaal’ vision of India@100.\nAmidst the pandemic, when every student has been forced to sit in front of laptops and work from home, under the PME-Vidhya Scheme, the new budget aims at expanding the existing 12 channels to 200 channels with the educational content being available in all regional languages for classes 1st to 12th. Not only this, to promote online training, Digital Ecosystem for Skilling and Livelihood (DESH-Stack e-portal) will be launched.\nOne of the oldest yet most significant sectors of our country: the post office sector will now come under a core banking system. One hundred per cent of 1.5 Lakh post offices will now be digitized which will not only be a boon to the farmers and the senior citizens but will also bring awareness towards the banking sector of Post office divisions.\n\nThere was a special emphasis on introducing a digital currency using blockchain which will be issued by the Reserve Bank of India (RBI) during the next financial year, making transactions much easier and faster. Amongst promoting the digital rupee, the Indian government has also shown certain acceptance towards the new cryptocurrency and its trading. Even though crypto as a currency might not be allowed but with the new 30% tax rule on profits made by digital assets, there is a possibility of it being accepted as an asset. With this, losses adhered to such assets will neither be allowed to be set off against any other asset or income nor be allowed to carry forward.\n\nDrones have gained major popularity amongst the Indian Government as was also shown during the Beating Retreat 2022. Under the Drone as a Service (DAS), Kisan Drones will be used for crop assessment, digitization of land records and even spraying nutrients. With the involvement of technology at every step, the Indian Government aims at making the agricultural sector more digitized and transparent along with launching funds with blended capital to finance agriculture start-ups. \nFascinatingly, it has been proposed that the R&D sector will be opened for academia, start-ups and industry with 25% of defence RnD budget embarked for the same. Industries thus can do a lot of RnD and in collaboration with DRDO can participate in design, development and growth benefiting the defence sector.\nIndia now looks at an eco-friendly and sustainable future. A lot of emphasis has been given to the use of natural resources like electricity and solar energy. In order to bring in sustainable electric vehicles, a battery swapping policy has been provided as an alternative to setting up charging stations in urban areas. This will be an eco-friendly approach while also saving time and cost in transitioning from diesel and petrol to batteries.\nThe plan to bring 5G to India is in full motion. The government will conduct the required spectrum auction in 2022 to bring in action 5G mobile services by private telecom providers. It is hoped that the telecommunication sector in general and 5G, in particular, will bring greater job opportunities and enable growth.\nIndia has successfully crushed British stereotypes and is now moving forward with a self-built nation identity. Digitalisation continues to gain momentum for futuristic and inclusive growth. Given the widespread energy on new-age technology, we are looking towards a promising future for Digital India and budget 2022 has laid the foundation to steer the economy over Amrit Kaal, continuing with the concept of sustainability on the vision of Budget 2021. \n\nReferences\n1. https://www.moneycontrol.com/news/photos/technology/budget-2022-a-look-at-some-major-tech-boost-for-digital-india-8021941.html\n2. https://timesofindia.indiatimes.com/blogs/voices/budget-2022-boost-for-the-tech-and-start-up-ecosystem/\n3. https://www.businesstoday.in/union-budget-2022/opinion/story/budget-2022-a-booster-for-the-digital-economy-321617-2022-02-06\n4. https://www.youtube.com/watch?v=b1eXYOkQOV0\n5. https://www.youtube.com/watch?v=NsIpX0eK3Mo&t=703s\n6. https://www.youtube.com/watch?v=YxdaXPMvOoA&t=953s\n7. https://www.youtube.com/watch?v=GOPkXuLiwJ4\n8. Picture Credits: https://www.constrofacilitator.com/the-expectations-from-union-budget-2022/","blog_slug":"india-s-union-budget-2022-2023-india-towards-digitization","published_date":"June 21"},{"title":"Hypothesis Testing in Datatab","Descrption":"I have always wondered what goes inside the heads of these statisticians who live and Breathe hypothesis and its testing.\n\nt’s funny how they first decide to assume things, build a hypothesis and then try their level best to find witnesses to discard it. \n\nSo, in the end, all they do is contradict their own theories?\n\nWell in today’s blog I am going to introduce to you the concept of hypothesis testing. And the irony? Well in the end, either you will reject or fail to reject your own hypothesis.\n\nWait for it!\n\nSo let me begin by introducing to you “The Stats Family”\n\nWe have two brothers Mr. Hypothesis Stats, the elder one, and Mr. Inference Stats, the younger one. They have two dogs, Alpha and Beta.\nThey are very close to their two grandmothers, Independent Sample Nanny and Dependent Sample Nanny.\nI know you must be wondering what weird names these are, (trust me I have been thinking the same about the entire hypothesis testing but who are we to judge) so just hang in there, it will all start to make sense in some time…hopefully!\nThe bigger game is that of inferential statistics under which, hypothesis testing is a subset. We usually tend to use hypothesis tests to draw inferences out of sample data and estimate the accuracy of the inference on population data.\nI will today introduce you to the basic understanding of hypothesis testing using a case study on a web application tool – DataTab https://datatab.net/\n\n#### DataTab.net is one of the most simple to use statistical apps that can perform the most advanced statistical analysis. So you definitely will enjoy using the tool.\n\n **First and foremost, what is hypothesis testing, and how is it conducted?**\n\nTo give you a basic idea, Mr. Hypothesis Stats works hard every day so that in the end he can come back home and give his greatest learnings of the day to his younger brother Mr. Inference Stats. He sometimes takes Inference to Independent Nanny’s home and sometimes to the dependent Nanny’s home. Without any bias, both these kids love their two grandmothers equally.\nHowever, They prefer dog beta to dog alpha while going to their nanny’s house because beta is well-behaved and alpha on the other hand bites ferociously. Read on and you will learn why and the story will start making sense! \n\n\n**Road Map for Inferential statistics.**\n\n\n\n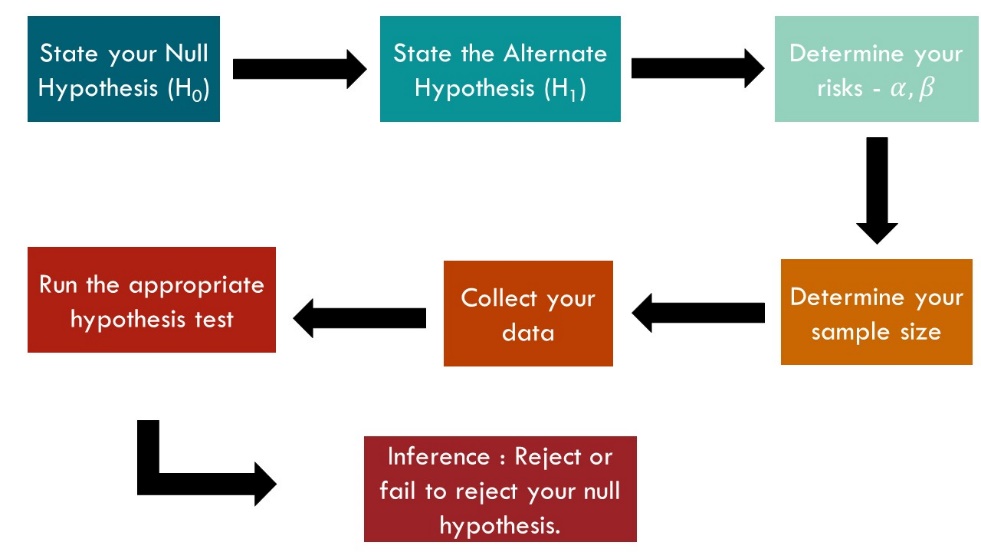\n\n**Step 1:** We begin by assuming a statement called the null hypothesis (H0) which is a statement involving a population parameter. Along similar lines, we state a statement alternative to it called the alternative hypothesis (H1) which is opposite to the null hypothesis.\n\n**Step 2:** One of the greatest life lessons Mr. Hypothesis has taught Mr. Inference is that every assumption involves risks and we must manage our risks in order to achieve greater success.\nOnly if millennials would get that!\nThus, whenever we draw inferences using sample data on the population, there is always a risk involved.\nHow much are you willing to accept the risk, confidence level of 99%, 95% or 90%. With the level of risk, one is ready to take, we set the level of significance which can be 0.01 or 0.05 or 0.1 corresponding to each confidence level. \n\n**Step 3:** While managing risks there can also be errors.\nEvery hypothesis testing comes with two types of errors\n\n*Type 1 Error: alpha*\n\nYou reject H0 when in reality it’s actually true! It’s unfair yes, but it happens many times. We call this kind of error an alpha error. \n\n*Type 2 Error: beta*\n\nYou fail to reject H0 when you should have.\nWe accept a hypothesis when in reality it’s actually wrong. \nBelow is a table that can give you a concise view. \n\n\n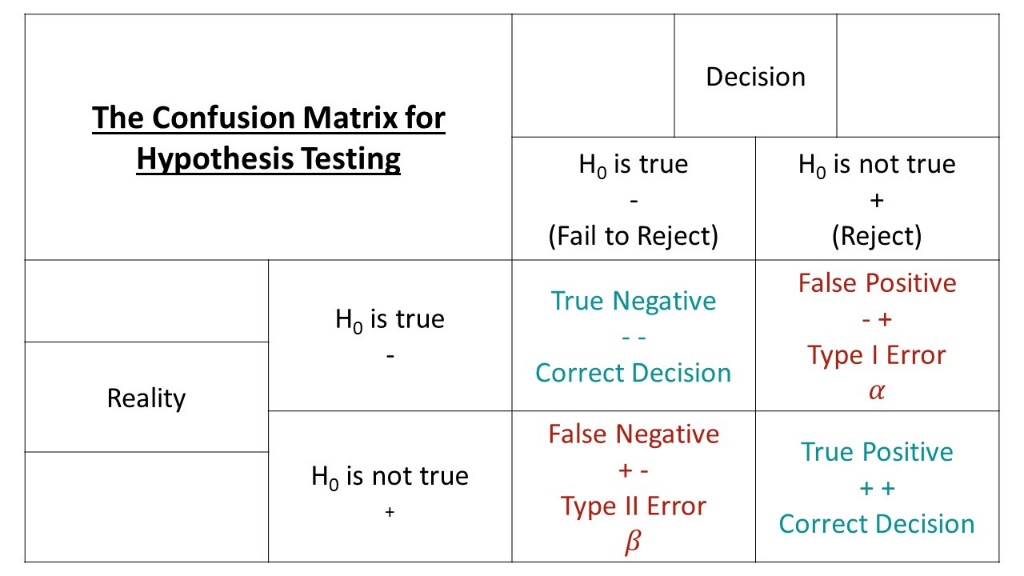\n\n\n**Step 4:** Once the hypothesis is stated we then carry out testing based on our parameters and data in order to reject H0 or fail to reject H0.\nTold ya!\n\n**Step 5:** Once we complete our testing, we obtain a p-value. It tells us what is the possibility of our results if we take our null hypothesis to be true. \nThe point to note is, that the p-value also called the observed level of significance if found to be less than our chosen level of significance, we reject our null hypothesis or else we fail to reject the null hypothesis.\nThis is the story of hypothesis testing.\nApologies for the trauma you are going through but it’s a part of life now.\n\n\n**The story of Dependent and Independent Nanny**\n\n\nDependent Nanny loves to cook and her favorite ingredient is potato. She experiments, creates, imagines, and invents the most amazing kinds of foods but keeps potatoes as the main and common ingredient like aloo-tikka and French fries.\nOn the other hand, Independent Nanny also loves to cook, but usually, her dishes are poles apart from each other. While she might cook fish, on one hand, she would also cook rajma-chawal on the other, and while both are fantastic dishes, they absolutely hold no similarities.\nDrawing the analogy from here, hypothesis testing is conducted on independent and dependent samples. \nTwo samples may be independent if they are not related to each other like fish and rajma chawal and are dependent if one sample can be used to draw estimations of other samples like aloo-Tikka and French fries.\nThis way, depending on the type of samples we use, our approaches for hypothesis testing also vary.\nI know, head spins much? It's okay, Let's visualize using DataTab and understand what is happening.\nKindly note that this case study only deals with the hypothesis and inference of samples and not the actual math that goes behind conducting hypothesis testing. Though studying that and learning from scratch is always recommended.\n\n#### **Case Study using DataTab**\n\n\nWe will use a dataset of the mileage of different car types: hatchback, wagon, sedan, coupe, and convertible.\n\n**Inserting and checking data**\n\nIn DataTab it is easy to upload a dataset by cut-copy method or by simply importing your .csv or .xsl file.\n\n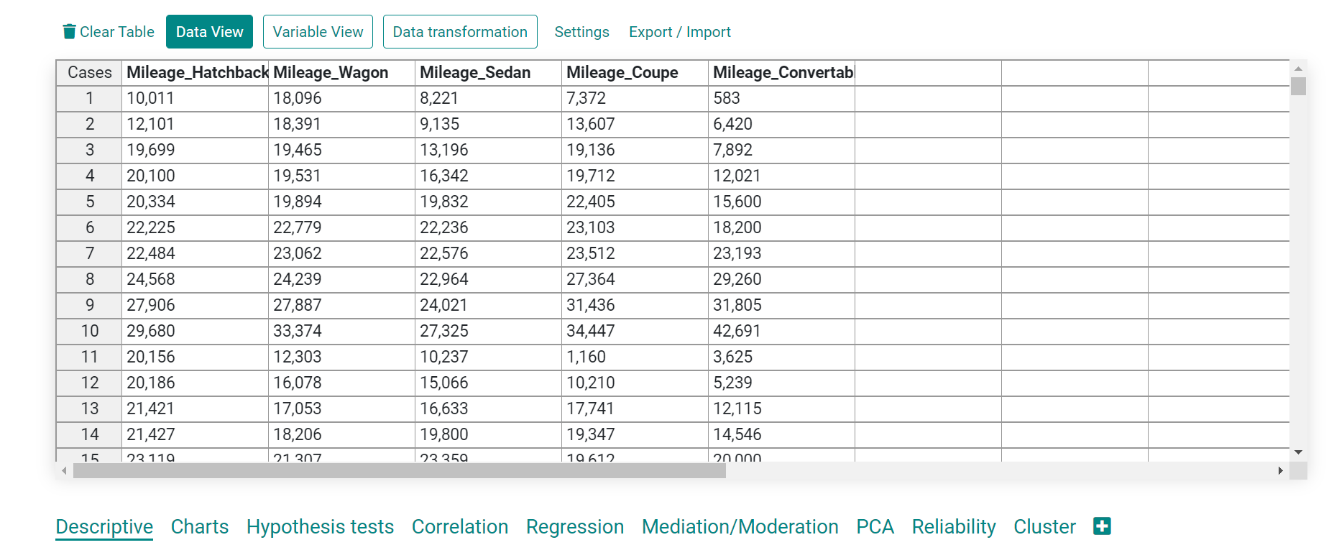\n\n\n\n**We chose two samples from this dataset, say mileage of hatchback and mileage of wagon.**\n\n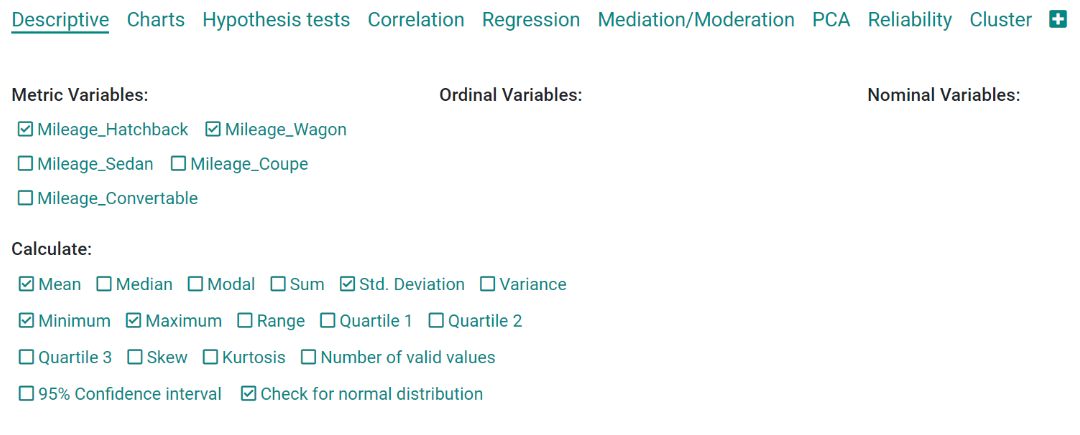\n\n\n**Let us first visualize in order to determine whether both these samples are normally distributed in order to decide which test to perform**\n\nDataTab allows us to choose our samples and plot different properties together.\n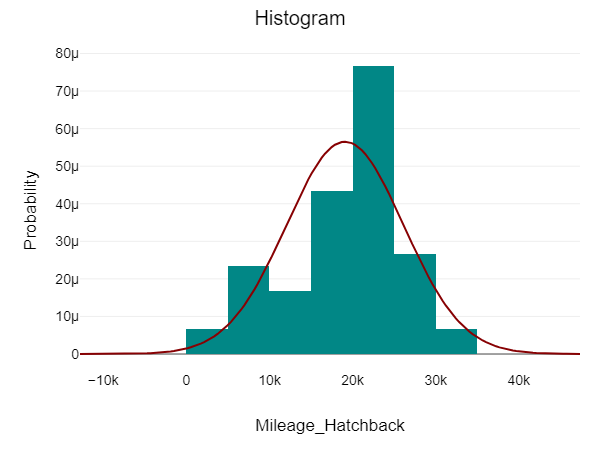\n\n\n\n\n\n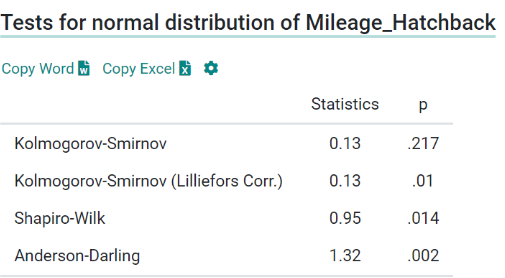\n\n\n\n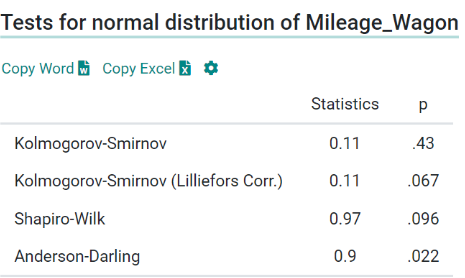\n\n\n\n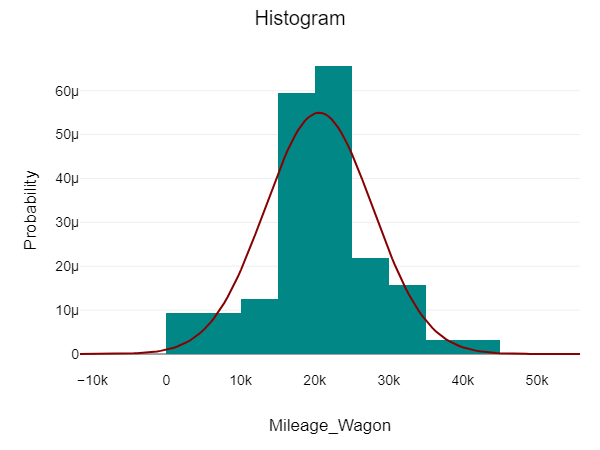\n\n\nFor both these samples, the data points (n) are greater than 50. Thus we follow the Kolmogorov-Smirnov test to test their normality.\nKolmogorov-Smirnov Test is a non-parametric test that assumes a null hypothesis that the sample comes from a normal distribution. If the p-value > 0.05 then the hypothesis is retained and the sample is said to be in a normal distribution.\nHere for both samples, the p-values are 0.217 and 0.43 respectively. Thus, our samples are normally distributed and we can go ahead with our hypothesis testing.\nNow, that both our samples are in normal distribution and sample size > 50, hence we can conduct the t-test for hypothesis testing.\n\n\n#### **t-test**\n\n**Step1:** Set desired parameters\nIn DataTab, conducting a t-test is just a matter of a few clicks.\n\n\n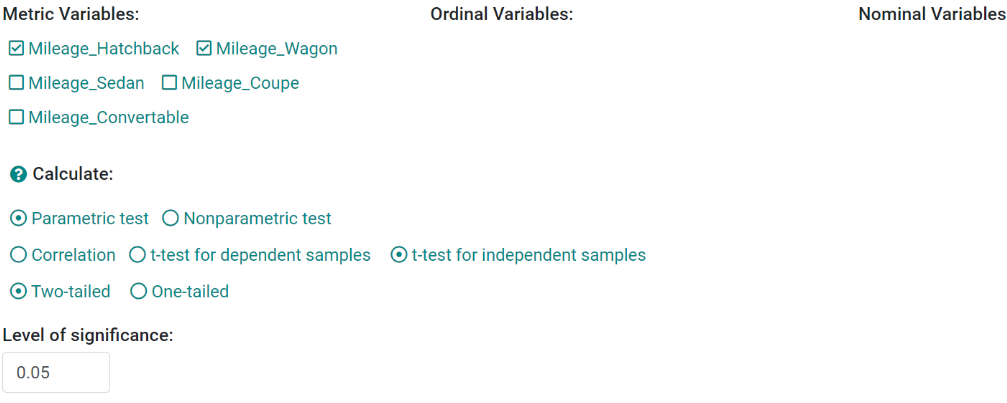\n\n\nWe chose two samples: Mileage_Hatchback and Mileage_Wagon.\nWe have to perform a parametric test which is a t-test for two independent samples.\n\t\n***Note:*** Our t-test will be two-tailed.\nWe also select the level of significance as 0.05.\n\n**Step 2:** Draw null and alternative hypothesis\n\n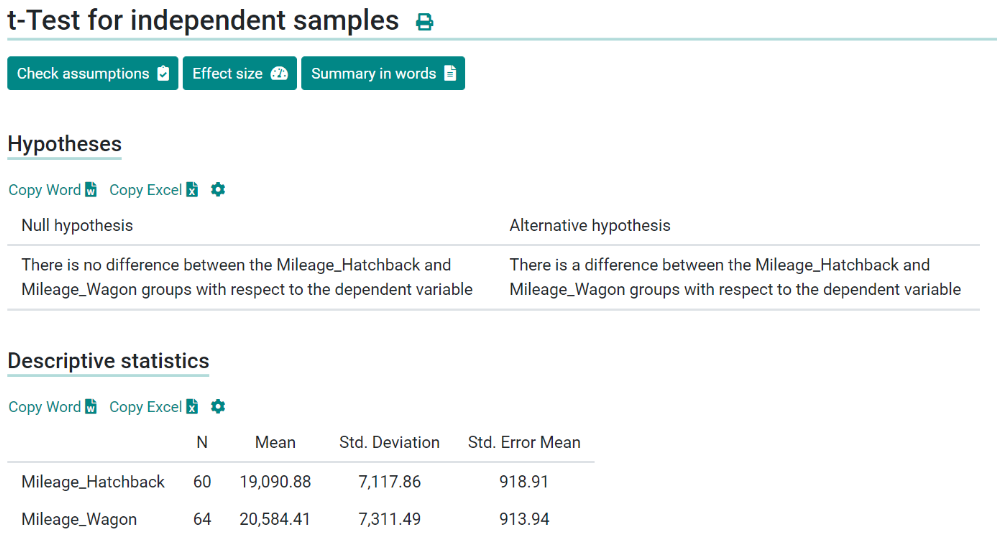\n\n\nDataTab is an intelligent software that draws both null and alternative hypotheses on its own for the user.\n\n#### Null Hypothesis: There is no difference between the Mileage_Hatchback and Mileage Wagon groups with respect to the dependent variables.\n#### Alternative Hypothesis: There is a difference between the Mileage_Hatchback and Mileage Wagon groups with respect to the dependent variables.\nAlso, note the standard deviations of the two samples are relatively closer/similar to one another.\n\n**Step 3:** **Conduct the t-test**\n\nWith equal variances, the p-value obtained for our t-test is 0.252.\np-value > level of significance (0.05)\nTherefore, we fail to reject our null hypothesis, and thus it is retained.\n\n\n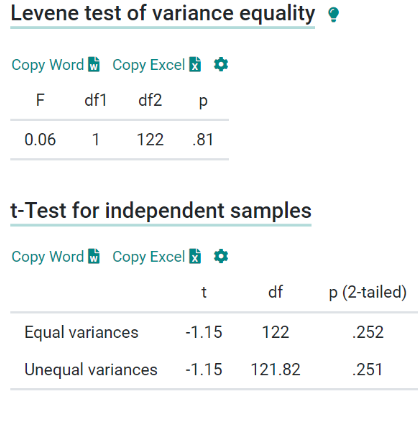\n\n\nOne of the most helpful features of DataTab is that it provides a summary of tests which can then be used directly in any kind of research work and projects.\n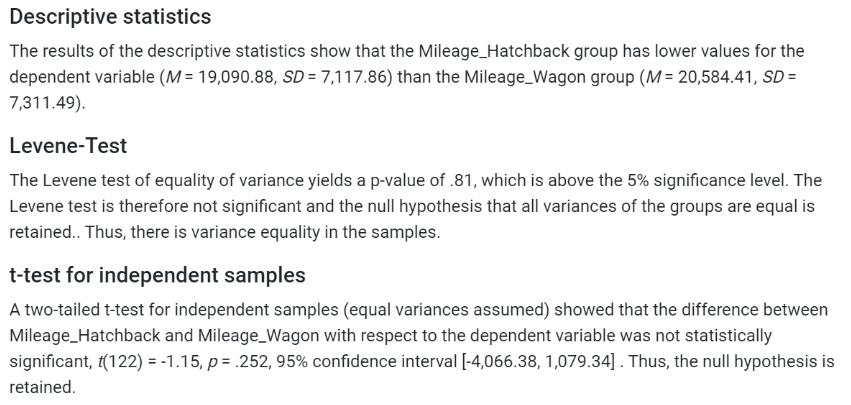\n\n\n**Step4:** **Inference**\n\n**Descriptive statistics-** The results of the descriptive statistics show that the Mileage_Hatchback group has lower values for the dependent variable (M = 19,090.88, SD = 7,117.86) than the Mileage_Wagon group (M = 20,584.41, SD = 7,311.49).\n\n**Levene-Test-** The Levene test of equality of variance yields a p-value of .81, which is above the 5% significance level. The Levene test is therefore not significant and the null hypothesis that all variances of the groups are equal is retained. Thus, there is variance equality in the samples.\n \n**t-test for independent samples-** A two-tailed t-test for independent samples (equal variances assumed) showed that the difference between Mileage_Wagon with respect to the dependent variable was not statistically significant, t(122) = -1.15, p = 0.252, 95% confidence interval [-4,066.38, 1,079.34] . \n\n***Thus, the null hypothesis is retained.***\n\n\n","blog_slug":"hypothesis-testing-using-datatab","published_date":"MAY - 25"}]},{"name_and_surname":"Fardeen Ahmed","short_description":"Fardeen is head of cyber security with Analogica. He is also chief mentor and instructor for Cyber security with Certisured.com. ","twitter_url":"https://certisured.com","linkedin_url":"https://www.linkedin.com/in/fardeen-ahmed-833bb8184/","designation":"Head of Cyber Security - Analogica ","image":{"localFile":{"childImageSharp":{"gatsbyImageData":{"layout":"constrained","backgroundColor":"#383838","images":{"fallback":{"src":"/static/3ae36272a3143085621ccafda47c38e0/c1045/11_8dcc13d371.jpg","srcSet":"/static/3ae36272a3143085621ccafda47c38e0/6cc20/11_8dcc13d371.jpg 185w,\n/static/3ae36272a3143085621ccafda47c38e0/0694e/11_8dcc13d371.jpg 370w,\n/static/3ae36272a3143085621ccafda47c38e0/c1045/11_8dcc13d371.jpg 740w","sizes":"(min-width: 740px) 740px, 100vw"},"sources":[{"srcSet":"/static/3ae36272a3143085621ccafda47c38e0/94adb/11_8dcc13d371.webp 185w,\n/static/3ae36272a3143085621ccafda47c38e0/04876/11_8dcc13d371.webp 370w,\n/static/3ae36272a3143085621ccafda47c38e0/18cb8/11_8dcc13d371.webp 740w","type":"image/webp","sizes":"(min-width: 740px) 740px, 100vw"}]},"width":740,"height":480}}}},"blogs":[]},{"name_and_surname":"Prakruthi N ","short_description":"Prakruthi N Guptha completed her undergraduate degree at Bangalore University. Throughout her studies, she developed a strong desire to keep up with the latest advancements in business intelligence. She was determined to become knowledgeable in Data Analysis and build a rewarding career in this field. As Prakruthi immersed herself in the subject, she enthusiastically explored various tools and techniques, finding them truly captivating and incredibly fascinating.","twitter_url":null,"linkedin_url":"http://www.linkedin.com/in/prakruthi-n-guptha","designation":"Market Research Analyst Intern ,Analogica","image":{"localFile":{"childImageSharp":{"gatsbyImageData":{"layout":"constrained","backgroundColor":"#f8f8f8","images":{"fallback":{"src":"/static/d385581253d69ea644ab72c5438fb7c3/09fb0/PRAKRUTI_7ee40e9239.jpg","srcSet":"/static/d385581253d69ea644ab72c5438fb7c3/8790d/PRAKRUTI_7ee40e9239.jpg 145w,\n/static/d385581253d69ea644ab72c5438fb7c3/c9cdb/PRAKRUTI_7ee40e9239.jpg 289w,\n/static/d385581253d69ea644ab72c5438fb7c3/09fb0/PRAKRUTI_7ee40e9239.jpg 578w","sizes":"(min-width: 578px) 578px, 100vw"},"sources":[{"srcSet":"/static/d385581253d69ea644ab72c5438fb7c3/130b4/PRAKRUTI_7ee40e9239.webp 145w,\n/static/d385581253d69ea644ab72c5438fb7c3/af82d/PRAKRUTI_7ee40e9239.webp 289w,\n/static/d385581253d69ea644ab72c5438fb7c3/3132e/PRAKRUTI_7ee40e9239.webp 578w","type":"image/webp","sizes":"(min-width: 578px) 578px, 100vw"}]},"width":578,"height":565}}}},"blogs":[{"title":"How to Choose the Right Visual to Tell Your Data Story: Tips from ‘Storytelling with Data’","Descrption":"### **How to Choose the Right Visual to Tell Your Data Story: Tips from ‘Storytelling with Data’**\n\nIn the data-driven world, Data Visualization plays a major role. However, not all visuals are equally effective in presenting the information. To create an impactful dashboard, it’s essential to identify the most relevant visuals. This blog aims to provide a comprehensive list of such visuals that can prove useful in creating an effective dashboard.\n\n#### **SIMPLE TEXT:**\nWhen we want to show the data, normally our brains think of tables or graphs. But we should not forget that we have another tool named simple text. When we have just a number or two to show, then showing just the number itself is much more powerful than burying them in a table or graph: putting just a couple of numbers into tables or graphs causes them to lose some of their vigors.\n\nSuppose, we want to mention: In a recent survey we asked our users if there is anything they would like to see us change.\n\nEg: Then we can represent it only like this, then using pie charts, bar graphs, etc, (to avoid complicating things)\n\n- NO CHANGES REQUIRED -\t88%\n- CHANGES REQUIRED -\t9%\n- DON’T KNOW EXACTLY -\t3%\n\n#### **TABLES:**\nTables are a useful means of exhibiting numerical or categorical information in a structured form. With their ability to simplify comparisons, they're ideal for presenting extensive amounts of data in condensed form. Nonetheless one should exercise caution when utilizing tables with detailed datasets as their efficiency may become compromised if they aren't formatted appropriately. It is also important to maintain appropriate headings.\n\nEg:\n\n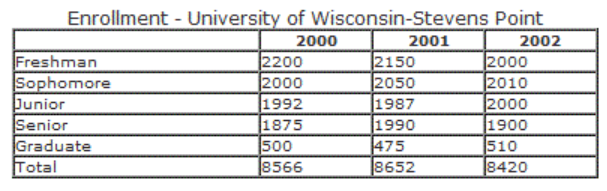\n\n\n#### **HEAT MAP:** \nHeat maps are quite popular for using color coding to represent the values in a matrix. They are very useful to identify the patterns and trends for complex datasets, particularly for areas of high concentration. The important aspects while creating heat maps are the proper color scheme, and labeling the axis and legend. It is commonly used in website activity tracking, market research, and in other places to identify any important information quickly.\n\nEg: \n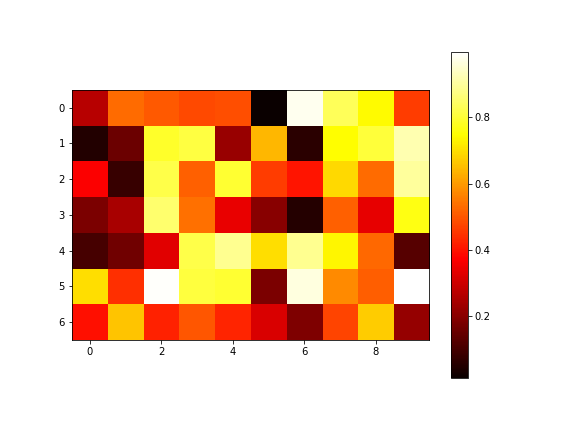\n\n\n#### **SCATTER PLOT:**\nA scatter plot is mainly used to identify relations between the two variables. It easily recognizes patterns, trends and. It displays the data as points, where the position of each point represents the values of the two variables on both axes. It helps to find if there is any positive or negative or no correlation between the variables, it also helps to identify outliers or any unusual patterns.\n\nEg:\n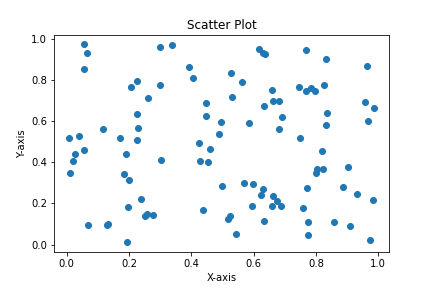\n\n\n#### **LINE GRAPHS:**\nLine graphs are mainly used to identify the changes in data over time. They are also used to identify trends, patterns, and relations between the variables. They display points with a line connecting them. The main use of this is that we will get to know easily the increases or decreases over time the period.\n\nEg:\n\n\n\n#### **SLOPE GRAPH:**\nA slope graph is used to compare the changes between two time periods. There will be two lines on the graph and each line represents a specific period. The slope of the lines shows the rate of changes in the data. They are used to identify trends or changes in data over time while comparing two time periods. It is not suitable for all types of datasets. If it is used properly it helps to display complex data in a clear and precise manner.\n\nEg:\n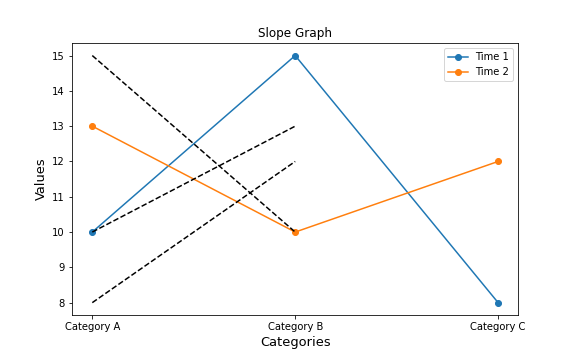\n\n\n#### **BAR GRAPH:**\nBar graphs are generally used to compare values of different categories of data. It displays data in the form of bars with different heights. It also helps to identify patterns. They are also used in industries like markets, finance, etc to display data in a visually appealing manner.\n\nEg:\n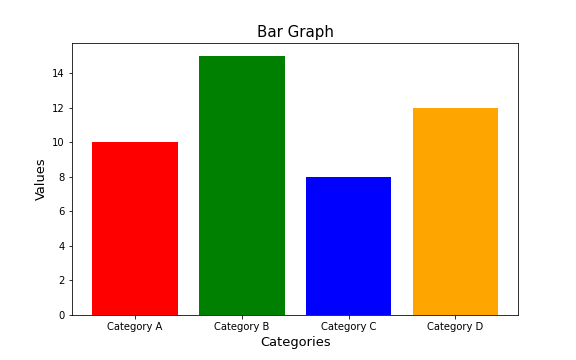\n\n\n#### **STACKED VERTICAL BAR GRAPH:**\nThe stacked vertical bar chart’s main intention is to show how different categories contribute to the total value of a group in a vertical manner. It is the next version of the bar graph, where each bar contains stacked segments, the segments represent different categories. They are useful in comparing the composition of multiple segments and also identifying trends or patterns.\n\nEg:\n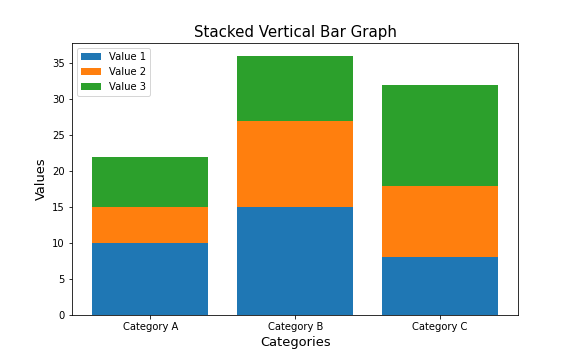\n\n\n\n#### **STACKED HORIZONTAL BAR GRAPH:**\nThe Stacked horizontal bar is just opposite the Stacked vertical bar chart. This chart’s main intention is to show how different categories contribute to the total value of a group in a horizontal manner. It is the next version of a bar graph, where each bar contains stacked segments, and the segments represent different categories. They are useful in comparing the composition of multiple segments and also identifying trends or patterns.\n\nEg:\n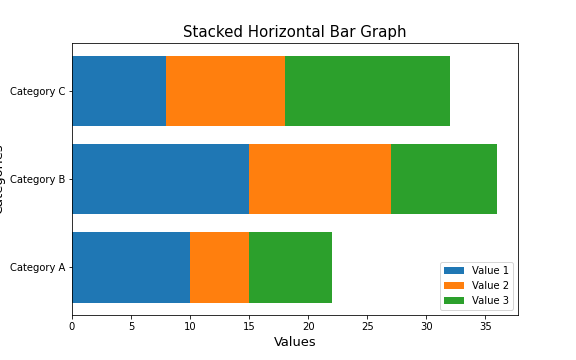\n\n\n#### **AREA CHART:**\nArea graphs should be avoided in most cases as human eyes don't do a great job of attributing quantitative value to two‐dimensional space which can render area graphs harder to read than some of the other types of visual displays. In one exception, an area chart can be used when we have to visualize the numbers of vastly different magnitudes.\n\nEg:\n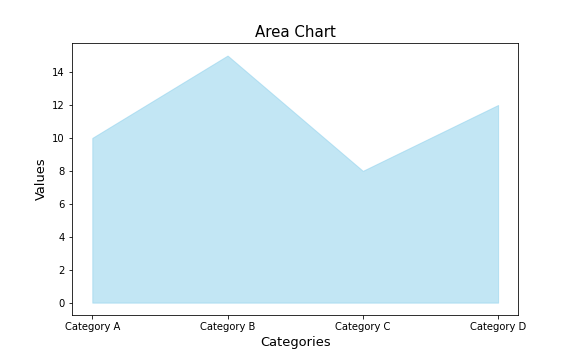\n\n\n#### **WATERFALL CHART:**\nThe waterfall chart can be used to pull apart the pieces of a stacked bar chart to focus on one at a time, or to show a starting point, increases and decreases, and the resulting ending point.\nIn the below figure, we can clearly see that it shows how headcount changed over the past year for the client group you support.\n\nEg:\n\n\n\n\nIn summary, we have discussed the most commonly used types of graphs, although there are many more to choose from. It is crucial to master the basics of data visualization before exploring more complex types of graphs. When selecting a graph, prioritize choosing one that effectively communicates your message to your audience. With less familiar types of graphs, extra care should be taken to ensure they are easily accessible and understandable. I hope this article has provided helpful insights for choosing the right chart. Your feedback and suggestions are welcome. This information is sourced from \"Storytelling with Data '' by Cole Nussbaumer Knaffic.\n\n\n\n\n\n\n\n\n\n\n\n\n\n\n","blog_slug":"how-to-choose-the-right-visual-to-tell-your-data-story-tips-from-storytelling-with-data","published_date":"8 June 2023"},{"title":"Data-driven Decision Making: How Analytics Influences Business Strategy","Descrption":"#### Introduction\nIn today's data-driven world, organizations recognize the power of leveraging data to make informed decisions. Data-driven decision-making, driven by analytics, has become a crucial component of successful business strategies. This blog post explores the significance of data-driven decision-making in shaping business strategies, highlighting its benefits, challenges, and best practices. Real-world examples showcase the impact of analytics on various aspects of business operations. So, let's embark on a journey through the realm of data-driven decision-making and discover how it influences business strategy. \n\n\n\n\n#### Section 1: The Power of Data-driven Decision Making\n\n- **Understanding Data-driven Decision-Making**\n\n**Definition and concept**\n\nData-driven decision-making involves using data as the basis for making informed choices, rather than relying solely on intuition. It emphasizes the analysis and interpretation of data to guide decision-making processes.\n\n**A shift from intuition-based to data-driven approaches** \n\nTraditionally, decisions were often made based on instincts and personal judgment. Data-driven decision-making recognizes the value of data in providing objective insights and is a move towards evidence-based decision-making.\n\n**Role of analytics**\n\nAnalytics is the process of examining data to uncover patterns, trends, and insights. It plays a vital role in extracting meaningful information from data, enabling organizations to make informed decisions based on data analysis.\n\n\n#### Section 2: Integrating Analytics into Business Strategy\n- **Leveraging Customer Analytics**\n\n**Utilizing customer data**\n\n Customer analytics involves analyzing customer data to understand their preferences, behaviors, and needs. It helps businesses gain insights into customer segments and tailor their marketing and sales strategies accordingly.\n\n**Personalizing customer experiences**\n\n By leveraging customer analytics, organizations can create personalized experiences for customers, enhancing their satisfaction and loyalty.\n\n**Targeted marketing and sales strategies** \n\nCustomer analytics enables businesses to identify customer segments with specific needs and preferences, enabling them to develop targeted marketing campaigns and sales strategies.\n\n- **Optimizing Operations and Supply Chain**\n\n**Applying Analytics to streamline processes**\n\nBy utilizing analytics, organizations can identify inefficiencies and bottlenecks in their operations and supply chain, allowing them to optimize processes and improve efficiency.\n\n**Predictive analytics for demand forecasting**\n\n Predictive analytics helps businesses forecast demand accurately, enabling them to optimize inventory levels, plan production, and minimize costs.\n\n**Enhancing supply chain visibility**\n\nAnalytics provides visibility into the supply chain, allowing organizations to track inventory, identify potential disruptions, and make data-driven decisions to improve supply chain management.\n\n\n\n\n\n- **Identifying Market Trends and Competitive Intelligence**\n\n**Monitoring market trends**\n\nAnalytics enables businesses to analyze market data and identify emerging trends, consumer preferences, and shifts in the competitive landscape.\n\n**Competitive intelligence**\n\nBy utilizing data analysis techniques, organizations can gain insights into their competitors' strategies, products, and market positioning, helping them make informed decisions to stay competitive.\n\n\n#### Section 3: Challenges and Best Practices\n- **Overcoming Data-related Challenges**\n\n**Data quality issues**\n\nEnsuring data accuracy, completeness, and reliability to maintain data integrity.\n\n**Data integration and management**\n\n Integrating data from various sources and ensuring proper data management practices.\n\n**Privacy and security concerns**\n\n Addressing privacy regulations and implementing appropriate security measures to protect sensitive data.\n\n- **Building Analytical Capabilities**\n\n**Acquiring technical skills**\n\nDeveloping the necessary skills within the organization to effectively analyse and interpret data.\n\n\n**Data-driven mindset**\n\nCultivating a culture that values data-driven decision-making and encourages employees to embrace analytics.\n\n**Collaboration between experts**\n\nFostering collaboration between data professionals and domain experts to derive meaningful insights from data.\n\n- **Embracing Agile and Iterative Approach**\n\n**Testing and iterating hypotheses**\n\nEmploying an iterative approach to test hypotheses and refine decision-making processes based on data insights.\n\n**Incorporating feedback loops**\n\n Implementing feedback mechanisms to continuously improve and optimize data-driven strategies.\n\n**Agile implementation**\n\nAdopting agile methodologies to implement data-driven strategies in a flexible and responsive manner.\n\n- **Ethical Considerations**\n\n**Ethical use of data**\n\nEnsuring that data is collected, stored, and used ethically, respecting privacy and consent.\n\n**Transparency and accountability**\n\nBeing transparent about data collection and usage practices, and holding responsible parties accountable for ethical data handling.\n\n\n**Compliance with regulations**\n\nAdhering to data protection and privacy regulations to maintain legal and ethical standards.\n\n\n#### Section 4: Real-world Examples of Data-driven Decision Making\n- **Netflix: Personalized Content Recommendations**\n\n**Leveraging user data**\n\nNetflix utilizes customer data to analyse viewing patterns and preferences, enabling personalized content recommendations tailored to individual users.\n\n**Improved user engagement**\n\nBy providing personalized content recommendations, Netflix enhances user engagement and satisfaction. Users are more likely to spend more time on the platform and continue their subscriptions, leading to increased revenue and customer loyalty.\n\n- **Walmart: Supply Chain Optimization**\n\n**Utilizing analytics for supply chain optimization**\n\nWalmart applies analytics to optimize its supply chain by analyzing data on inventory levels, demand forecasting, and logistics. This helps in streamlining operations, reducing costs, and improving overall efficiency.\n\n**Enhanced operational efficiency and cost savings**\n\nWalmart's data-driven supply chain optimization allows for improved inventory management, reduced stockouts, and minimized transportation costs. This leads to increased operational efficiency and cost savings for the company.\n\n- **Amazon: Predictive Analytics for Sales Forecasting**\n\n**Utilizing predictive analytics**\n\nAmazon leverages historical sales data and employs predictive analytics models to forecast future sales patterns accurately. This helps in optimizing inventory levels, managing product availability, and meeting customer demands.\n\n**Optimized inventory management and improved customer satisfaction**\n\nBy accurately predicting sales trends, Amazon ensures that popular products are well-stocked, reducing the chances of inventory shortages. This results in improved customer satisfaction as customers can find and purchase the products they desire.\n\n\n#### Conclusion\nData-driven decision-making, empowered by analytics, is a game-changer for businesses. \n\nOrganizations can make informed choices, optimize operations, enhance customer experiences, and gain a competitive advantage by leveraging data insights. \n\nOvercoming challenges and following best practices, such as aligning analytics with strategic goals and fostering a data-driven culture, are essential for success. \n\nThe real-world examples of industry leaders demonstrate the transformative impact of data-driven decision-making. \n\nEmbracing data-driven strategies is no longer an option but a necessity for organizations striving to thrive in today's data-centric business landscape.\n\n","blog_slug":"data-driven-decision-making","published_date":"01-12-2023"}]},{"name_and_surname":"Pruthvi Raj R","short_description":"Pruthvi Raj is studying Computer Science in Diploma at SJP Govt Polytechnic","twitter_url":null,"linkedin_url":"https://www.linkedin.com/in/pruthvi-raj-409397259/","designation":"ML & AI Intern At Certisured","image":{"localFile":{"childImageSharp":{"gatsbyImageData":{"layout":"constrained","backgroundColor":"#183868","images":{"fallback":{"src":"/static/7a4f9ed64f3c1abbcc0f92613f23588a/b7a3e/pruthvi_raj_b74000d220.png","srcSet":"/static/7a4f9ed64f3c1abbcc0f92613f23588a/2aec1/pruthvi_raj_b74000d220.png 134w,\n/static/7a4f9ed64f3c1abbcc0f92613f23588a/c6b96/pruthvi_raj_b74000d220.png 268w,\n/static/7a4f9ed64f3c1abbcc0f92613f23588a/b7a3e/pruthvi_raj_b74000d220.png 536w","sizes":"(min-width: 536px) 536px, 100vw"},"sources":[{"srcSet":"/static/7a4f9ed64f3c1abbcc0f92613f23588a/10848/pruthvi_raj_b74000d220.webp 134w,\n/static/7a4f9ed64f3c1abbcc0f92613f23588a/2bbc4/pruthvi_raj_b74000d220.webp 268w,\n/static/7a4f9ed64f3c1abbcc0f92613f23588a/d8251/pruthvi_raj_b74000d220.webp 536w","type":"image/webp","sizes":"(min-width: 536px) 536px, 100vw"}]},"width":536,"height":554}}}},"blogs":[{"title":" \"Unleashing the Power of Pandas: A Beginner's Journey into Data Manipulation\"","Descrption":"# Pandas\n\n\n\nIn this Blog, I will be writing about all the basic information that you need to know about Pandas such as what is Pandas, why we use them, The applications of Pandas, and Getting started with Pandas, etc.\n\n#### **What is Pandas?**\nPandas is a popular open-source Python library for data manipulation and analysis. It provides data structures for efficiently storing and manipulating large and complex datasets, as well as functions for performing common data manipulation tasks such as filtering, grouping, and joining.\n\n#### **Why do we use Pandas?**\nPandas is a popular Python library for data analysis and manipulation, offering flexible tools for handling different data formats, cleaning, filtering, transforming, and visualizing data. It is essential for efficient data analysis in Python.\n\n#### **The applications of pandas**\n\n\n\n\nPandas is a versatile and find applications in various domains. It can be used for financial analysis, scientific research, business analytics, social media analysis, web analytics, and machine learning tasks. With its data manipulation capabilities, Pandas proves valuable for analyzing and processing data in different fields, including finance, research, business, social media, web, and machine learning.\n\n\n#### **Getting started with Pandas**\nSetup and Installation\nBefore we move on with code for understanding the features of Pandas,let’s get Pandas installed in your system\n\nInstall Pandas\n\n> pip install pandas\n\nJupyter Notebook\n\n> pip install jupyter\n\nJupyter Notebook is an open-source web application for creating and sharing documents with live code, equations, visualizations, and text. It's popular among data scientists, researchers, and educators for interactive data analysis and collaboration. The notebook format enables easy organization and sharing of code and results, promoting reproducible research\n\n\n\n#### **Sample Data**\nHere I am using a iris dataset, It comprises of each petal and sepal length and their width and also with their species.\n#### **Load data with Pandas**\nLoading data with pandas involves reading data from different file formats such as CSV, Excel, SQL, and more. Pandas provide various functions to load data from these file formats, such as read_csv(), read_excel(), read_sql(), and others. Once the data is loaded into a pandas DataFrame, it can be manipulated, cleaned, and analyzed using various pandas functions and methods.\n\n**From CSV File**\n\n\n\nYou can load data by giving the CSV file name in the pd.read_csv()function.\n\n\n\nYou can load data by giving its file path also.\n\n**Understanding Data**\n\nNow that we have the DataFrame ready let’s go through it and understand what’s inside it.\n\n - To show you a gist of data use\n - **df.head()**\n \n\n\n - To show the statistical value of data use\n - **df.describe()**\n\n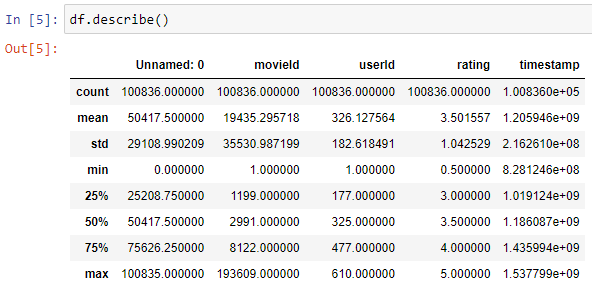\n\n - To show the columns in the data use\n - **df.columns**\n\n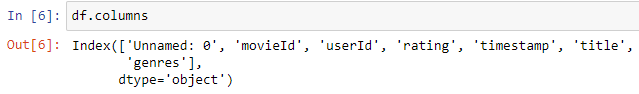\n\n**Pick & Choose your Data**\n\nNow that we have loaded our data and understood its structure. let's pick and choose and perform operations on the data.\n\n**Selecting Columns**\n\n - Create a list of columns to be selected\n\n\n\n - Use it as an index to the DataFrame\n\n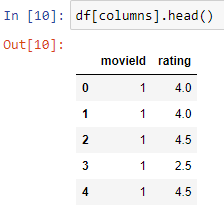\n\n - Using the loc method\n\n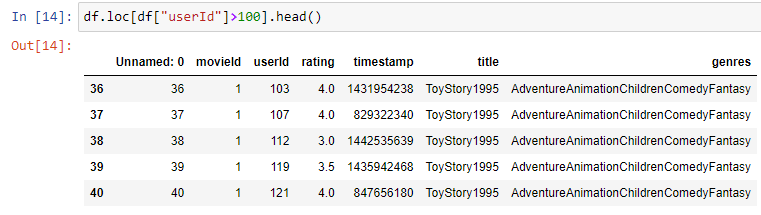\n\n\n**Selecting Rows** \n\nSelecting rows is the process of filtering a Pandas DataFrame to only include rows that meet certain criteria. \n\n - using numerical indexes - iloc\n\n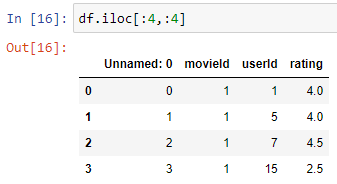\n\n - using labels as index-loc\n\n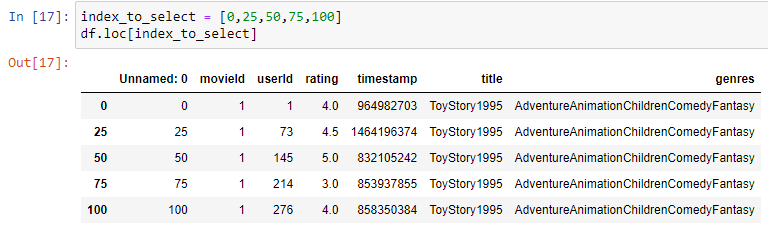\n\n\n#### **How to handle Missing values in pandas**\n\n\n\nHandling missing data is an essential part of working with data, and Pandas provides several methods for dealing with missing data in DataFrames. In this article, we will discuss some of the common methods for handling missing data in Pandas.\n\n**Identify missing data**\n\nThe first step in handling missing data is to identify where it exists in the DataFrame. We can use the isnull() function to check for missing data, which will return a Boolean value indicating whether each element in the DataFrame is null or not.\n\n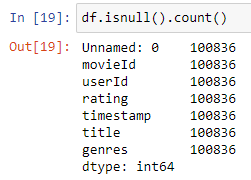\n\n\n**Remove missing data**\n\nOne option for handling missing data is to simply remove it from the DataFrame. We can use the dropna() function to remove any rows or columns that contain missing data. This can be useful when the missing data is in a small percentage of the DataFrame and removing it will not significantly affect the analysis.\n\n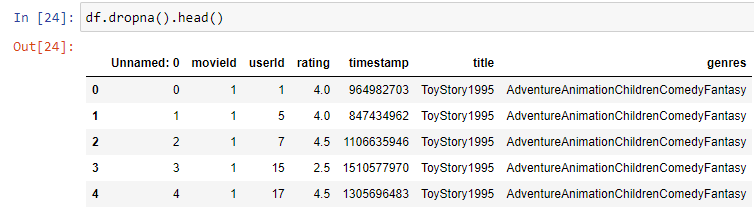\n\n\n**Fill missing data**\n\nAnother option for handling missing data is to fill it in with an appropriate value. We can use the fillna() function to fill in missing data with a specified value or method. For example, we can fill in missing data with the mean or median value of the column, or with a value from a previous or subsequent row.\n\n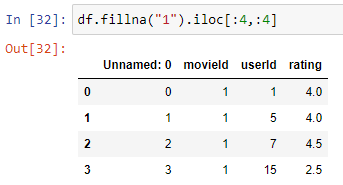\n\n\n\n#### **Data cleaning and transformation techniques using Pandas**\n\n\n\n\nData cleaning and transformation are critical steps in the data analysis process, and Pandas provides a variety of functions and methods for performing these tasks\n\n**Removing Duplicates**\n\nPandas provides the drop_duplicates() method to remove duplicate rows from a dataframe. By default, this method removes duplicates based on all columns, but you can also specify a subset of columns to consider.\n\n\n\n\n**Handling Outliers**\n\nHandling outliers in Pandas involves identifying and removing the data points that are significantly different from other observations in the dataset. Outliers can be caused by measurement errors, data entry errors, or other factors, and can have a significant impact on statistical analysis and machine learning models.\n\n\n\n\n**Changing Data Types**\n\nPandas provides the astype() method to change the data type of one or more columns in a dataframe. You can specify the new data type as a string, or use one of the numpy data types.\n\n\n\n\n**Filtering Data**\nPandas provides several methods for filtering data, including query(), loc[], and iloc[]. These methods allow you to select rows or columns based on specified criteria.\n\n\n\n\n**Pivot Tables**\nPandas provides the pivot_table() method to create a pivot table from a dataframe. This method allows you to group data based on one or more columns, and then calculate summary statistics for each group.\n\n\n\n\n#### **The Benefits of Data Cleaning**\n\n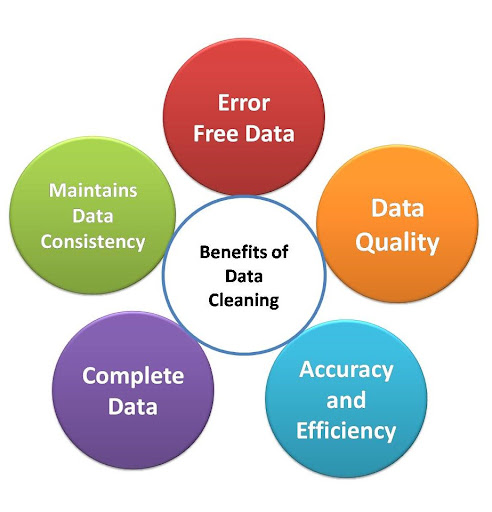\n\nData cleaning is essential for improving data quality. It involves identifying and correcting errors, ensuring data consistency, and removing redundant or irrelevant information. Data cleaning leads to better analysis, easier integration of data from multiple sources, faster processing, and improved data visualization.\n\n**Conclusion**\n\nPandas is a Python library that simplifies data analysis and visualization. It offers various plotting tools, like line plots, bar plots, scatter plots, and pie charts, which can be customized. Handling missing values is easy with dropna() and fillna() functions. Pandas also helps with data cleaning and transformation tasks, such as removing duplicates, replacing values, renaming columns, and converting data types.\n\n\n\n","blog_slug":"unleashing-the-power-of-pandas-a-beginner-s-journey-into-data-manipulation","published_date":"15 June 2023"}]},{"name_and_surname":"Name Surname 3","short_description":"Lorem ipsum dolor sit amet, consectetur adipiscing elit. Dictumst mi nascetur in luctus est id phasellus risus egestas. Leo convallis velit pharetra, lectus.","twitter_url":"https://certisured.com","linkedin_url":"https://certisured.com","designation":"Designation","image":{"localFile":{"childImageSharp":{"gatsbyImageData":{"layout":"constrained","backgroundColor":"#f8c8e8","images":{"fallback":{"src":"/static/3923a0ea53ee3270ee0cb1dd89de2031/fae27/pexels_nubia_navarro_nubikini_3221215_6de3571a82.jpg","srcSet":"/static/3923a0ea53ee3270ee0cb1dd89de2031/6c903/pexels_nubia_navarro_nubikini_3221215_6de3571a82.jpg 756w,\n/static/3923a0ea53ee3270ee0cb1dd89de2031/44670/pexels_nubia_navarro_nubikini_3221215_6de3571a82.jpg 1512w,\n/static/3923a0ea53ee3270ee0cb1dd89de2031/fae27/pexels_nubia_navarro_nubikini_3221215_6de3571a82.jpg 3024w","sizes":"(min-width: 3024px) 3024px, 100vw"},"sources":[{"srcSet":"/static/3923a0ea53ee3270ee0cb1dd89de2031/dd945/pexels_nubia_navarro_nubikini_3221215_6de3571a82.webp 756w,\n/static/3923a0ea53ee3270ee0cb1dd89de2031/76fb3/pexels_nubia_navarro_nubikini_3221215_6de3571a82.webp 1512w,\n/static/3923a0ea53ee3270ee0cb1dd89de2031/7d916/pexels_nubia_navarro_nubikini_3221215_6de3571a82.webp 3024w","type":"image/webp","sizes":"(min-width: 3024px) 3024px, 100vw"}]},"width":3024,"height":4032}}}},"blogs":[]},{"name_and_surname":"Diwakar Rao D R","short_description":"Diwakar Rao D R is a Cyber Security Student with Certisured . Diwakar Rao D R is highly passionate about Hacking and Cyber Security.","twitter_url":"https://twitter.com/DiwakarRaoDR16?t=G6IK5sIswIb_bWyiIy78pg&s=09","linkedin_url":"https://www.linkedin.com/in/diwakar-rao-d-r-143bb425b","designation":"Cybersecurity Student","image":{"localFile":{"childImageSharp":{"gatsbyImageData":{"layout":"constrained","backgroundColor":"#b8c8e8","images":{"fallback":{"src":"/static/f134a244bc1b34af3a5db37ecf385197/fc41f/14783ebb_ec9f_4753_8292_31da0866a691_1_5d8ebe494e.jpg","srcSet":"/static/f134a244bc1b34af3a5db37ecf385197/de4ad/14783ebb_ec9f_4753_8292_31da0866a691_1_5d8ebe494e.jpg 210w,\n/static/f134a244bc1b34af3a5db37ecf385197/3f415/14783ebb_ec9f_4753_8292_31da0866a691_1_5d8ebe494e.jpg 420w,\n/static/f134a244bc1b34af3a5db37ecf385197/fc41f/14783ebb_ec9f_4753_8292_31da0866a691_1_5d8ebe494e.jpg 839w","sizes":"(min-width: 839px) 839px, 100vw"},"sources":[{"srcSet":"/static/f134a244bc1b34af3a5db37ecf385197/7f961/14783ebb_ec9f_4753_8292_31da0866a691_1_5d8ebe494e.webp 210w,\n/static/f134a244bc1b34af3a5db37ecf385197/e7e42/14783ebb_ec9f_4753_8292_31da0866a691_1_5d8ebe494e.webp 420w,\n/static/f134a244bc1b34af3a5db37ecf385197/b1c57/14783ebb_ec9f_4753_8292_31da0866a691_1_5d8ebe494e.webp 839w","type":"image/webp","sizes":"(min-width: 839px) 839px, 100vw"}]},"width":839,"height":742.0000000000001}}}},"blogs":[{"title":"Malware","Descrption":"**Malware {malicious software } as we hear the word we get that there is something suspicious about it, as we all know that is software that is dangerous in the world of computers & computer network world, the software can cause extensive damage to data and systems or gain unauthorized access to a network.**\n\n- In 1990 **Yisrael Radai, a computer scientist** and security researcher used the word MALWARE.\n\n- The father of malware is Frederick B. Cohen, he started an experiment that could infect a computer & it was also able to spread from one to another computer.\n\n- The world’s first malware or virus was made by Pakistani brothers named Basit and Amjad Farooq Alvi who ran a computer store & The first virus name is BRAIN as it was reported by secure list reports.\n\nMalware is mainly used by Hackers As so many people don’t know what is a malware As if some people know what is a malware they don’t know that it has so many types in it like it has been mentioned below 👇\n\n- First is **Ransomware**, a type of malicious software (malware) that threatens to publish data or permanently block access to data unless a ransom is paid. It can be used to target individuals, organizations, businesses, and critical infrastructure. Ransomware is one of the most dangerous and prevalent cyber threats, as it can lead to serious financial losses and reputational damage. It is also increasingly being used as a tool for espionage and political attacks. Victims need to understand the risks associated with ransomware and take the necessary steps to protect their systems from this threat. Moreover, organizations should have a comprehensive plan to detect, respond to, and recover from ransomware attacks.\n\n\n\n\n- Second is **Fileless malware** is a malware/virus which is used to steal sensitive information, install additional malware, or gain control of a system. It is important to keep software up to date and to be cautious when downloading and opening files, especially from unknown sources. Additionally, having reliable anti-virus software and regularly updating it can help protect against file-less malware and other cyber threats.\n\n\n\n\n- Third is **Spyware** is a malware/virus which collects the information of the user without any type of consent from the user, It can collect the user's data or information, passwords, pins, banking information, etc. Spyware can be used in mobiles & applications also. It can also be used to create backdoors for hackers to gain access to the device, resulting in severe security risks. Spyware can be very hard to detect and can be highly damaging, so users should always take steps to protect their computers and mobile devices from such malicious software.\n\n\n\n\n- Fourth is **Adware**. We can use it as spyware. it collects or we can track all the information that users search in the browser & determine which ads to serve us. It also collects all types of activities like where we have traveled, what we have purchased, and who are our friends. it collects the information & shares or sells it without the user’s consent.\n\n\n\n\n- Fifth is that **Trojan** can disguise itself as any type of software. Once it has been downloaded by an unsuspecting user, a trojan can take entire control of the user's system & the control could be taken for malicious purposes, it may be hidden in apps, games, emails, etc. Trojans can be difficult to detect and remove, as they often hide their activities and do not exhibit symptoms like other malware. It is important to keep software up to date and to exercise caution when downloading and installing new programs, as well as to have reliable anti-virus software installed.\n\n\n\n\n- Sixth is **Worms** target the weakness or vulnerabilities of the user’s system & get installed into the user’s network. They can get several access in many ways such as through software vulnerabilities or flash drives, they can steal sensitive data, or can do ransomware attacks on users’ systems.\n\n\n\n\n- Seventh is **Virus** can get itself to an application & executes when the application runs. when the virus gets into a network, it may steal sensitive data like files, personal/confidential pictures, etc. & DDoS { Distributed Denial Of Service } or Ransomware attacks\n\n\n\n\n- Eighth is **Rootkits** is software that gives access to hackers or we can also call malicious actors remote control of victim’s devices with full access permission Rootkits can be injected in apps, hypervisors { a program used to run and manage one or more virtual machines on a computer }. They can through phishing emails or mail with unknown attachments which are downloaded by the victim.\n\n\n\n\n- Ninth is **Keyloggers**, the type of spyware that captures keystrokes. It is often used by cybercriminals to steal sensitive information such as passwords, credit card numbers, and personal details. Keyloggers can be installed without the user's knowledge, making them difficult to detect and prevent. They can be used to monitor employees in a company setting, but this practice is considered unethical in most cases. It is important to install trusted anti-virus software and keep it updated to protect against keyloggers and other types of malware.\n\n\n\n\n- Tenth is **Bots / Botnets** also known as robots, which are automated software programs that can perform tasks or automate processes. Botnets are collections of infected devices controlled by a common threat actor. These devices can be used to launch coordinated attacks, such as distributed denial-of-service (DDoS) attacks, spamming, and the spread of malware. They can be difficult to detect, as they often hide their activities and blend in with normal network traffic. It is important to keep software and devices up to date, avoid downloading files from untrusted sources, and use reliable anti-virus software to help protect against botnets and other cyber threats.\n\n\n\n\n- Eleventh is **Mobile Malware** is a type of malicious software that targets smartphones, tablets, and other mobile devices. It can get into the device through unwanted applications, unknown texts, unknown mail & many more. It can be used to steal sensitive information, spy on the device's user, or use the device as part of a larger botnet for malicious purposes. It is important to be careful when downloading and installing apps, especially from untrusted sources. It is also recommended to keep the operating system and apps up to date and to use a reliable mobile security solution to help protect against mobile malware and other cyber threats.\n\n\n\n\n- Twelveth **Wiper Malware** is a type of malicious software that is designed to destroy or erase data on a target device or network. Unlike other types of malware, the goal of wiper malware is not to steal information, but to cause disruption and damage. It can be spread through the mail, and removable devices like pen drives, hard drives, etc. It can be used for politically or financially motivated attacks and can cause widespread damage to businesses, governments, and critical infrastructure. it is difficult to detect and recover from, and in some cases, data loss may be permanent.\n\n\n\n\n","blog_slug":"malware","published_date":"16 march 2023"}]},{"name_and_surname":"Chethan","short_description":"Chethan is studying Computer Science in Diploma at SJP Govt Polytechnic","twitter_url":null,"linkedin_url":"https://www.linkedin.com/in/chethan-cd-b51b18259/","designation":"ML & AI Intern At Analogica","image":{"localFile":{"childImageSharp":{"gatsbyImageData":{"layout":"constrained","backgroundColor":"#f8f8f8","images":{"fallback":{"src":"/static/fe947024431c94527a0d360573757717/5c3c8/Chethan_80089c88e7.jpg","srcSet":"/static/fe947024431c94527a0d360573757717/78fdd/Chethan_80089c88e7.jpg 94w,\n/static/fe947024431c94527a0d360573757717/25476/Chethan_80089c88e7.jpg 189w,\n/static/fe947024431c94527a0d360573757717/5c3c8/Chethan_80089c88e7.jpg 377w","sizes":"(min-width: 377px) 377px, 100vw"},"sources":[{"srcSet":"/static/fe947024431c94527a0d360573757717/d4832/Chethan_80089c88e7.webp 94w,\n/static/fe947024431c94527a0d360573757717/a6f8a/Chethan_80089c88e7.webp 189w,\n/static/fe947024431c94527a0d360573757717/046fe/Chethan_80089c88e7.webp 377w","type":"image/webp","sizes":"(min-width: 377px) 377px, 100vw"}]},"width":377,"height":333}}}},"blogs":[{"title":"NUMPY","Descrption":"## **Introduction to NumPy**\n#### **Overview of the Library and Its Benefits**\n\n- NumPy, short for Numerical Python, is a popular library for data analysis and scientific computing in Python. \n- It provides powerful tools for working with arrays, which are essential data structures for scientific computing.\n- NumPy arrays are similar to lists in Python, but they offer several advantages for numerical computation.\n- NumPy arrays are faster and more memory-efficient than lists, and they support vectorized operations, which enable you to perform computations on entire arrays at once.\n\n#### **Benefits:**\n\n- **Efficient data handling:** NumPy is designed to handle large multidimensional arrays and matrices efficiently, allowing for fast and efficient data manipulation and analysis.\n- **Powerful mathematical functions:** NumPy provides a wide range of powerful mathematical functions, including linear algebra, Fourier transforms, and random number generation.\n- **Interoperability with other libraries:** NumPy is designed to work seamlessly with other scientific computing libraries in Python, including Matplotlib, Pandas, and SciPy.\n- **Open-source:** NumPy is open-source and freely available, allowing for widespread adoption and development by the scientific computing community.\n\n#### **Usage of Numpy?**\n\nNumPy arrays are the foundation of the library and are homogeneous, meaning that they contain elements of the same data type. \n\nNumPy arrays can be created using various methods, such as by converting a list or tuple to an array or by using NumPy functions like linspace or arrange.\n\nOne of the main advantages of using NumPy is its speed and efficiency. NumPy arrays are much faster than Python lists and can handle large amounts of data efficiently. \n\nThis makes it an ideal choice for data processing tasks that require complex mathematical operations.\n\n**Installation**\n> pip install numpy\n\nNumPy can be installed using pip, a package management system in Python. Open your \nterminal or command prompt and run the following command:\n\nThis will install the latest version of NumPy.\n\n#### **Why do we import NumPy?**\n\nWorking with NumPy entails importing the NumPy module before you start writing the code.\n\nWhen we import NumPy as np, we establish a link with NumPy. We are also shortening the word “numpy” to “np” to make our code easier to read and help avoid namespace issues.\n\n> import numpy as np\n\nThe standard NumPy import, under the alias np, can also be named anything you want it to be.\n\n**Creating NumPy Arrays:**\n\nTo create a NumPy array, you can use the numpy.array() function. This function takes a Python list as input and returns a NumPy array. \n\n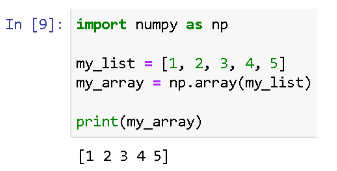\n\n\n**Indexing and Slicing NumPy Arrays:**\n\nYou can access individual elements of a NumPy array using indexing. NumPy arrays are zero-indexed, which means that the first element has an index of 0.\n\n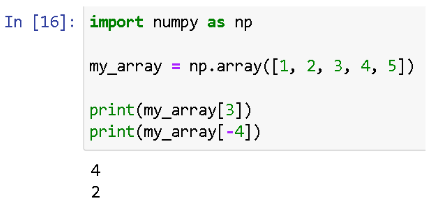\n\nYou can also access a subset of elements from a NumPy array using slicing. Slicing allows you to extract a portion of an array based on a specified range of indices.\n\n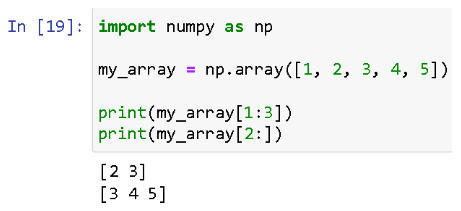\n\n\n**Speeding up Your Code with NumPy: Vectorization and Performance Optimization**\n\nVectorization is the process of performing operations on entire arrays or matrices at once, instead of using for loops to perform the same operations on individual elements. This can significantly improve the performance of your code since NumPy is optimised for these types of operations.\n\nFor example, suppose we have two 1D arrays a and b with 100 elements each, and we want to compute the dot product of the arrays. We could do this using a for loop, like so:\n\n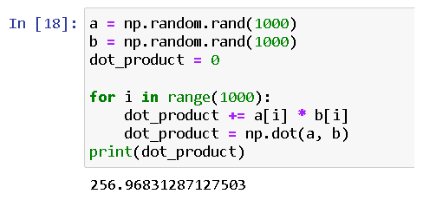\n\n\nThis code is much simpler, and it is also much faster. In general, it is a good idea to use vectorization whenever possible, since it can simplify your code and improve performance.\n\n**Use NumPy Functions**\n\nNumPy provides a wide range of functions for performing mathematical operations on arrays and matrices. These functions are often highly optimised for performance, and they can be much faster than writing your own code using for loops.\n\nFor example, suppose we have a 2D array with 1000 rows and 100 columns, and we want to compute the mean of each column. We could do this using a for loop, like so:\n\n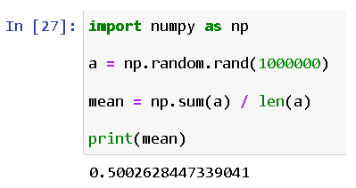\n\n\nThis code is much simpler, and it is also much faster. In general, it is a good idea to use NumPy functions whenever possible, since they are often highly optimised for performance.\n\n\n**Arithmetic operations in NumPy**\n\n**Maths Operations:**\n\nNumPy provides many built-in functions for performing maths operations on arrays. \n\n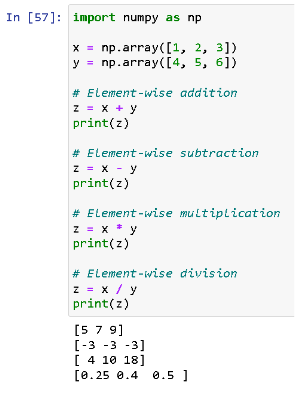\n\n\n**Statistics Operations:**\n\nNumPy provides many built-in functions for performing statistics operations on arrays.\n\n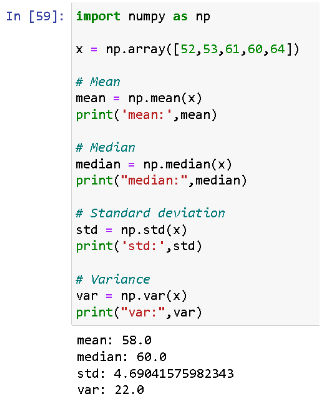\n\n\n**Linear Algebra Operations:**\n\nNumPy provides many built-in functions for performing linear algebra operations on matrices. \n\n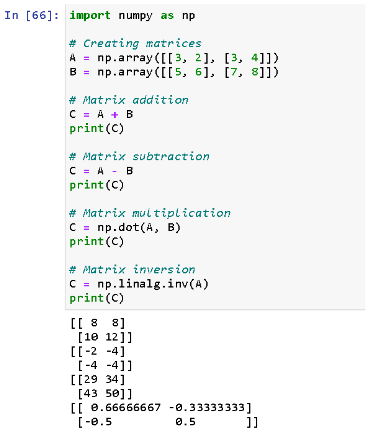\n\n\n#### **Broadcasting in NumPy?**\n\nBroadcasting is the ability of NumPy to perform arithmetic operations on arrays with different shapes and sizes, by stretching or duplicating the smaller array to match the shape of the larger array. Broadcasting is possible if the smaller array can be replicated along one or more axes to match the shape of the larger array.\n\nFor example, consider the following two arrays:\n\nArray a has shape (2, 2) and the array b has shape (2,). To add these two arrays, we can use broadcasting:\n\n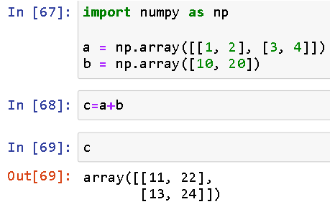\n\nIn this example, the smaller array b was broadcast along the second axis to match the shape of the larger array a. The resulting array c has the same shape as a.\n\n#### **When to Use Broadcasting**\n\nBroadcasting is a powerful feature of NumPy that allows us to perform arithmetic operations on arrays of different shapes and sizes. It is particularly useful when we want to avoid unnecessary copying of data, and when we want to write code that is more concise and readable.\n\n#### **NumPy Array vs. Python Lists**\n\n\n\nWhen it comes to numerical computing in Python, you have two primary options: NumPy arrays or Python lists. While both have their benefits and drawbacks, NumPy arrays are generally considered to be the better option for numerical computing tasks.\n\n#### **Python Lists / NumPy Arrays**\n\nPython lists are a built-in data type in Python that allow you to store and manipulate collections of data. While they are easy to use and versatile, they are not ideal for numerical computing tasks.\n\nNumPy is a powerful library in Python that provides a high-performance multidimensional array object, along with a suite of functions for performing mathematical operations on arrays.\n\n#### **Which is Better for Numerical Computing?**\n\nWhile both NumPy arrays and Python lists have their benefits and drawbacks, NumPy arrays are generally considered to be the better option for numerical computing tasks. With its statically typed arrays and suite of mathematical functions, NumPy provides a powerful tool for working with large datasets and performing complex mathematical operations.\n\n\n\n\n#### **Data Visualization with NumPy and Matplotlib.**\n\n\n\nNumPy and Matplotlib, which is a powerful combination for data visualisation in Python. Scatter plots are useful for visualising the relationship between two variables, and in this case, we are using randomly generated data to demonstrate how to create a scatter plot with NumPy and Matplotlib.\n\n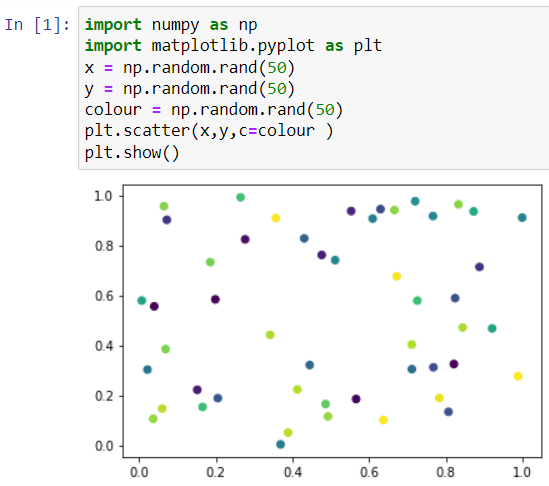\n\n\n#### **Conclusion**\n\nNumPy is a powerful library for numerical computing in Python. It provides efficient array operations, mathematical functions, and tools for data manipulation and analysis. By utilizing NumPy, developers can perform complex computations with ease, handle multidimensional data structures effectively, and enhance the performance of their numerical tasks. Its integration with other libraries like Matplotlib further extends its capabilities for data visualization. NumPy is an essential tool for anyone working with numerical data in Python, offering simplicity, efficiency, and versatility.","blog_slug":"numpy","published_date":"15 June 2023"}]},{"name_and_surname":"name 1","short_description":"descriptiom","twitter_url":"https://twitter.com","linkedin_url":"https://linkedin.com","designation":"Designation","image":{"localFile":{"childImageSharp":{"gatsbyImageData":{"layout":"constrained","backgroundColor":"#486878","images":{"fallback":{"src":"/static/22b7eba3ee8cba0c531390e24e3dcc5e/82c11/Ana_Icon_Transparent_500x500_Compressed_Q_7c3e306080.png","srcSet":"/static/22b7eba3ee8cba0c531390e24e3dcc5e/2fd20/Ana_Icon_Transparent_500x500_Compressed_Q_7c3e306080.png 125w,\n/static/22b7eba3ee8cba0c531390e24e3dcc5e/de391/Ana_Icon_Transparent_500x500_Compressed_Q_7c3e306080.png 250w,\n/static/22b7eba3ee8cba0c531390e24e3dcc5e/82c11/Ana_Icon_Transparent_500x500_Compressed_Q_7c3e306080.png 500w","sizes":"(min-width: 500px) 500px, 100vw"},"sources":[{"srcSet":"/static/22b7eba3ee8cba0c531390e24e3dcc5e/d66e1/Ana_Icon_Transparent_500x500_Compressed_Q_7c3e306080.webp 125w,\n/static/22b7eba3ee8cba0c531390e24e3dcc5e/e7160/Ana_Icon_Transparent_500x500_Compressed_Q_7c3e306080.webp 250w,\n/static/22b7eba3ee8cba0c531390e24e3dcc5e/5f169/Ana_Icon_Transparent_500x500_Compressed_Q_7c3e306080.webp 500w","type":"image/webp","sizes":"(min-width: 500px) 500px, 100vw"}]},"width":500,"height":500}}}},"blogs":[]},{"name_and_surname":"Sumer Pasha","short_description":"Sumer Pasha is a Python Automation Engineer with Analogica India. He is a python developer and uses python to develop internal utilities for Analogica.","twitter_url":"https://twitter.com/SameerP99025","linkedin_url":"https://www.linkedin.com/in/sumer-pasha-70884a152/","designation":"Python Automation Engineer","image":{"localFile":{"childImageSharp":{"gatsbyImageData":{"layout":"constrained","backgroundColor":"#e8c8d8","images":{"fallback":{"src":"/static/01cf8e8808109e278e25694d1e663c54/37851/sumer_6a36f7eba7.jpg","srcSet":"/static/01cf8e8808109e278e25694d1e663c54/5b1fa/sumer_6a36f7eba7.jpg 115w,\n/static/01cf8e8808109e278e25694d1e663c54/f0f53/sumer_6a36f7eba7.jpg 230w,\n/static/01cf8e8808109e278e25694d1e663c54/37851/sumer_6a36f7eba7.jpg 460w","sizes":"(min-width: 460px) 460px, 100vw"},"sources":[{"srcSet":"/static/01cf8e8808109e278e25694d1e663c54/f8466/sumer_6a36f7eba7.webp 115w,\n/static/01cf8e8808109e278e25694d1e663c54/84992/sumer_6a36f7eba7.webp 230w,\n/static/01cf8e8808109e278e25694d1e663c54/b5c5b/sumer_6a36f7eba7.webp 460w","type":"image/webp","sizes":"(min-width: 460px) 460px, 100vw"}]},"width":460,"height":460}}}},"blogs":[{"title":"Exploring the Core Principles of Decision Tree in Machine Learning","Descrption":"Decision Tree in machine learning is a part of the classification algorithm which also provides solutions to the regression problems using the classification rule; its structure is like the flowchart where each of the internal nodes represents the test on a feature (e.g., whether the random number is greater than a number or not), each leaf node is used to represent the class label( results that need to be computed after taking all the decisions) and the branches represents conjunction conjunctions of features that lead to the class labels.\n\nDecision Tree in Machine Learning has a wide field in the modern world. There are a lot of algorithms in ML which is utilized in our day-to-day life. One of the important algorithms is the Decision Tree used for classification and a solution for regression problems. As a predictive model, Decision Tree Analysis is done via an algorithmic approach where a data set is split into subsets as per conditions. The name says it is a tree-like model in the form of if-then-else statements. The deeper the tree and more are the more nodes, the better the model.\n\n**Types of decision tree**\n\nA Decision Tree is a tree-like graph where sorting starts from the root node to the leaf node until the target is achieved. It is the most popular one for decision and classification based on supervised algorithms. It is constructed by recursive partitioning where each node acts as a test case for some attributes and each edge, deriving from the node, is a possible answer in the test case. Both the root and leaf nodes are two entities of the algorithm.\n\nsmall example as follows:\n\n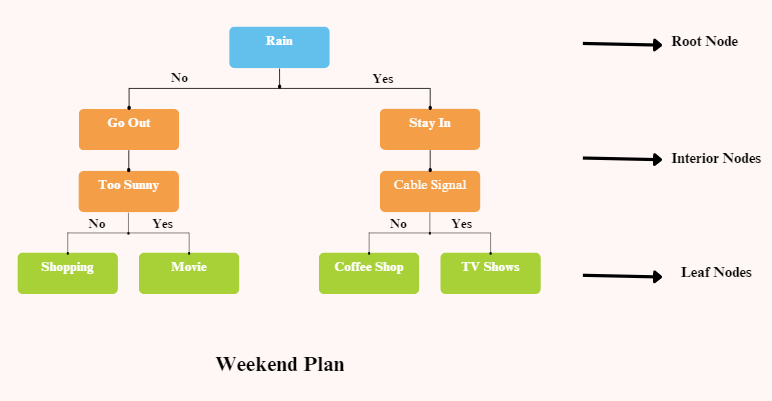\n\n\n**There are two types of Decision Trees:**\n\n1. **Classification Trees:** The above example is a categorial-based Classification Tree.\n2. **Regression Trees:** In this type of algorithm, the decision or result is continuous. It has got a single numerical output with more inputs or predictors.\n\nIn the Decision tree, the typical challenge is identifying each node's attribute. The process is called attribute selection and has some measures to use in order to identify the attribute.\n\n\n**a. Information Gain (IG)**\n\nInformation Gain measures how much information an individual feature gives about the class. It acts as the main key to constructing a Decision Tree. An attribute with the highest Information Gain splits first. So, the Decision Tree always maximizes the Information Gain. When we use a node to partition the instances into smaller subsets, then the entropy changes.\nEntropy: It is the measure of uncertainty or impurity in a random variable. Entropy decides how a Decision Tree splits the data into subsets.\n\nThe equation for Information Gain and entropy are as follows:\n\nInformation Gain= entropy(parent)- [weighted average*entropy(children)] \n\nEntropy: ∑p(X)log p(X)\n\nP(X) here is the fraction of examples in a given class.\n\n**b. Gini Index**\n\nGini Index is a metric that decides how often a randomly chosen element would be incorrectly identified. It clearly states that attribute with a low Gini Index is given first preference.\n\nGini Index: 1-∑ p(X)^2\n\n**Split creation**\n1. To create a split, first, we need to calculate the Gini score.\n2. The data is split using a list of rows having an index of an attribute and a split value of that attribute. After the right and left dataset is found, we can get the split value by the Gini score from the first part. Now, the split value will be the decider of where the attribute will reside.\n3. The next part evaluates all the splits. The best possible value is calculated by evaluating the cost of the split. The best split is used as a node of the Decision Tree.\n\n**Building a tree – decision tree in machine learning:**\n\nThere are two steps to building a Decision Tree.\n\n**1. Terminal node creation**\nWhile creating the terminal node, the most important thing is to note whether we need to stop growing trees or proceed further. The following ways can be used for this:\n- **Maximum tree depth:** When the tree reaches the maximum number of nodes, execution stops there.\n- **Minimum node records:** It can be defined as a minimum of patterns that a node requires. Then we can stop adding terminal nodes immediately after we get those minimum node records.\n\n**2. Recursive splitting**\nOnce, the node is created, we can create a child node recursively by splitting the data set and calling the same function multiple times.\n\n**Prediction**\n\nAfter a tree is built, the prediction is done using a recursive function. The same prediction process is followed again with left or right child nodes and so on.\n\n**Advantages and disadvantages of decision tree**\n\n**Advantages**\n\nThe decision tree has some advantages in Machine Learning as follows:\n- **Comprehensive:** It takes consideration of each possible outcome of a decision and traces each node to the conclusion accordingly.\n- **Specific:** Decision Trees assign a specific value to each problem, decision, and outcome(s). It reduces uncertainty and ambiguity and also increases clarity.\n- **Simplicity:** Decision Tree is one of the easier and reliable algorithms as it has no complex formulae or data structures. Only simple statistics and maths are required for calculation.\n- **Versatile:** Decision Trees can be manually constructed using maths and as well be used with other computer programs.\n\n\n**Disadvantages**\n\nThe decision tree has some disadvantages in Machine Learning as follows:\n- Decision trees are less appropriate for estimation and financial tasks where we need an appropriate value(s).\n- It is an error-prone classification algorithm as compared to other computational algorithms.\n- It is computationally expensive. At each node, the candidate split must be sorted before ascertaining the best. There are other alternatives that many business entities follow for financial tasks as Decision Tree is too expensive for evaluation.\n- While working with continuous variables, Decision Tree is not fit as the best solution as it tends to lose information while categorizing variables.\n- It is sometimes unstable as small variations in the data set might lead to the formation of a new tree.\n\n\n\n\n\n","blog_slug":"exploring-the-core-principles-of-decision-tree-in-machine-learning","published_date":"26 April 2023"},{"title":"K-Nearest Neighbor(KNN) Algorithm for Machine Learning","Descrption":"## **K-Nearest Neighbor(KNN) Algorithm for Machine Learning**\n- K-Nearest Neighbour is one of the simplest Machine Learning algorithms based on Supervised Learning\ntechniques.\n- K-NN algorithm assumes the similarity between the new case/data and available cases and put the new\ncase into the category that is most similar to the available categories.\n- K-NN algorithm stores all the available data and classifies a new data point based on the similarity. This\nmeans when new data appears then it can be easily classified into a good suite category by using K- NN\nalgorithm.\n- K-NN algorithm can be used for Regression as well as for Classification but mostly it is used for the\nClassification problems.\n- K-NN is a non-parametric algorithm, which means it does not make any assumption on underlying data.\n- It is also called a lazy learner algorithm because it does not learn from the training set immediately instead\nit stores the dataset and at the time of classification, it performs an action on the dataset.\n- KNN algorithm at the training phase just stores the dataset and when it gets new data, then it classifies that\ndata into a category that is much similar to the new data.\n- Example: Suppose, we have an image of a creature that looks similar to a cat and a dog, but we want to know\nwhether it is a cat or a dog. So for this identification, we can use the KNN algorithm, as it works on a similarity\nmeasure. Our KNN model will find the similar features of the new data set to the cats and dog’s images and\nbased on the most similar features it will put it in either the cat or dog category.\n\n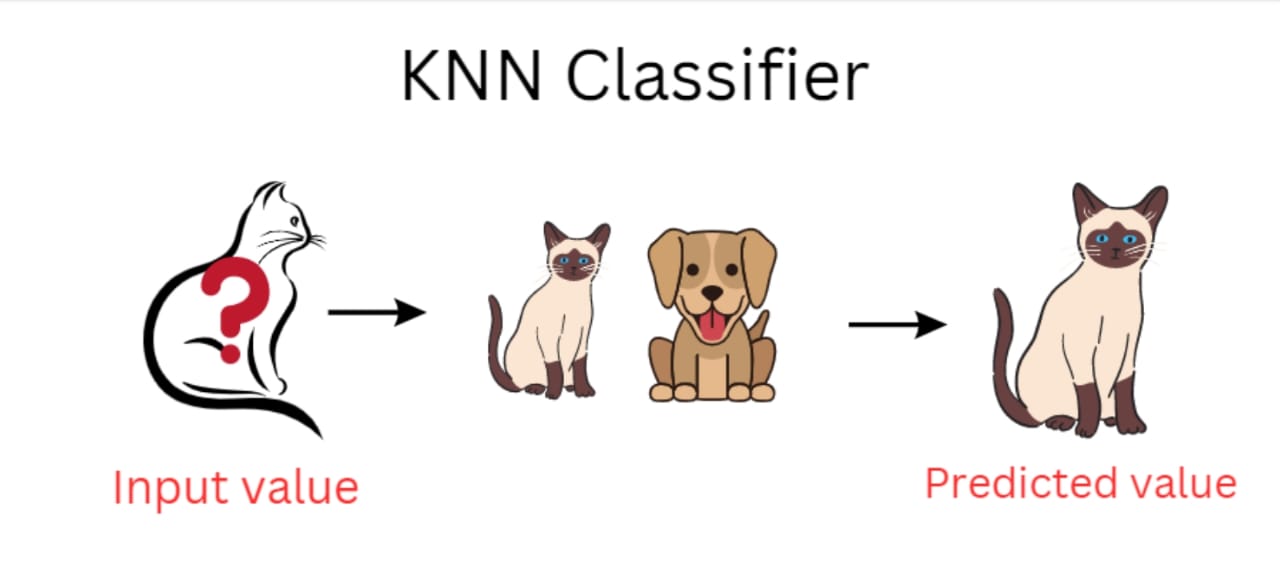\n\n\n### **Why do we need a K-NN Algorithm?**\n\nSuppose there are two categories, i.e., Category A and Category B, and we have a new data point x1, so this\ndata point will lie in which of these categories? To solve this type of problem, we need a K-NN algorithm.\nWith the help of K-NN, we can easily identify the category or class of a particular dataset. Consider the\nbelow diagram:\n\n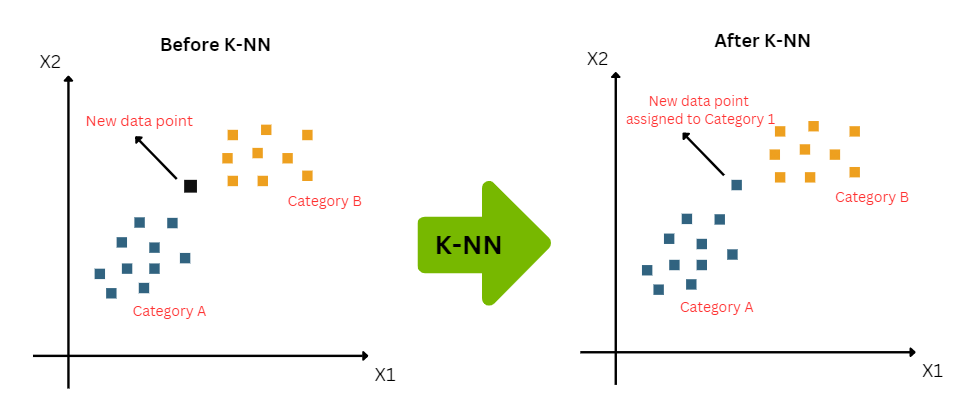\n\n### **How does K-NN work?**\n\nThe K-NN working can be explained on the basis of the below algorithm:\n- Step-1: Select the number K of the neighbors\n- Step-2: Calculate the Euclidean distance of K number of neighbors\n- Step-3: Take the K nearest neighbors as per the calculated Euclidean distance.\n- Step-4: Among these k neighbors, count the number of the data points in each category.\n- Step-5: Assign the new data points to that category for which the number of neighbors is maximum.\n- Step-6: Our model is ready.\n\nSuppose we have a new data point and we need to put it in the required category. Consider the below image:\n\n\n \n \n \n Category \n ETL Process \n ELT Process \n \n \n Sequence of Operation \n Extract, Transform, Load \n Extract, Load, Transform \n \n \n Transformation Location \n Occurs in a separate staging area or dedicated server \n Occurs within the target system \n \n \n Target System \n Data warehouse or storage system optimized for analysis \n Data warehouse or storage system optimized for analysis \n \n \n Processing power \n Transformation occurs before loading, often suitable for source systems with limited processing power \n Leverages the processing power of the target system \n \n \n Speed \n ETL is Slower than ELT \n ELT is faster than ETL as it can use the internal resources of the data warehouse \n \n \n \n Data compatibility \n Best with structured Data \n It can handle structured, semi-structured, and unstructured data \n  \n
\n \n
\n \n
\n
\nThere are four types of algorithm behind KNN
\n**1. Brute Force ( algorithm=”brute”)**\n- The brute force in KNN calculates the distance between the query point and each point in the dataset and then it sorts these distances and finds the nearest neighbors.This method is simple , straightforward and doesn’t rely on any special data structure for efficient searching\n- It is best for small datasets where the computational cost for each point is manageable. Brute force provides flexibility by computing the exact distances without depending on specific data structures\n- The main drawback of the brute force is that it becomes very slow as the dataset size increases.In high-dimensional and large datasets , the computational time increases since it requires to calculate distances to every data point.\n\n**2. KD – Tree ( algorithm=”kd_tree”)**\n- The KD-Tree (k-dimensional data) is a space-partitioning data structure that divides the dataset into regions along the feature axes.At each level of the tree,the data is split into two subsets based on a selected axis and this process is repeated recursively.These splitting allows algorithm to search for nearest neighbors more efficiently portions of irrelevant data.\n- KD Tree is particularly for low- dimensional data (<20) features.In such cases KD Tree excels by reducing the number of comparisons required during the search process and making it to faster than Brute force\n- The main drawback of KD Tree is the performance reduces in high dimensional spaces. As the number of features increases ,the partition becomes less effective and the search time approaches that of brute force.This is due to curse of dimensionality where data is evenly distributed and make space partitioning less efficient\n\n**3. Ball Tree ( algorithm = \"ball_tree\" )**\n- Ball Tree is another space-partitioning data structure that arranges data points into a tree of nested hyper-spheres (balls), rather than axis-aligned areas as in KD-Tree.\n- It creates a binary tree by recursively dividing the data into two parts. Each node in the tree contains a ball that surrounds a subset of points.\n- This technique outperforms KD-Tree with medium- to high-dimensional data since it does not rely on axis-aligned splits.\n- It is generally more efficient than brute force for larger datasets with higher dimensions.\nBall Tree is more adaptable to managing different distance measurements, such as Manhattan, Minkowski, and so on.\n\n\n### **Advantages of KNN Algorithm:**\n- It is simple to implement.\n- It is robust to the noisy training data\n- It can be more effective if the training data is large.\n\n### **Disadvantages of KNN Algorithm:**\n- Always needs to determine the value of K which may be complex sometimes.\n- The computation cost is high because of calculating the distance between the data points for all the\ntraining samples.","blog_slug":"k-nearest-neighbor-knn-algorithm-for-machine-learning","published_date":"13 May 2025"},{"title":"Introduction to Tkinter: A Beginner's Guide","Descrption":"## **Introduction to Tkinter: A Beginner's Guide**\nPython is widely known for its simplicity and readability, making it a favorite among developers for various domains—including data science, web development, automation, and more. One area where Python also excels is in building **Graphical User Interface (GUI)** applications. Among several libraries available for creating GUIs, **Tkinter** stands out as the standard choice for Python developers. Whether you're a beginner or a seasoned programmer, Tkinter provides an accessible yet powerful platform to create interactive desktop applications.\n\n
\n\n### **What is Tkinter?**
\n**Tkinter** is the standard GUI library for Python. It serves as a Python binding to the **Tk GUI toolkit**, which originally came from the Tcl (Tool Command Language) scripting language. Tkinter provides a collection of modules, classes, and functions that allow developers to build native desktop applications with graphical elements such as windows, buttons, text fields, and more.
\nTkinter comes bundled with the Python standard library, meaning there’s no need for separate installation—if you have Python installed, you already have Tkinter!\n\n
\n\n### **Why Choose Tkinter?**\nTkinter offers a host of advantages that make it an ideal starting point—and sometimes even the final choice—for building desktop GUIs in Python.
\n#### **Key Benefits of Using Tkinter**\n- **Beginner-Friendly and Easy to Learn:**
Tkinter’s straightforward syntax and intuitive structure make it accessible even to those new to GUI development. Most tutorials and books use Tkinter, making it easier to find learning resources.\n- **Included with Python:**
Unlike other libraries such as PyQt or Kivy, Tkinter requires no additional installations. It’s \nbuilt-in, lightweight, and ready to use out of the box.\n- **Cross-Platform Compatibility:**
Applications built with Tkinter work on Windows, macOS, and Linux without any code changes. This portability ensures a broader audience and consistent user experience.\n- **Fast Prototyping and Rapid Development:**
With ready-made widgets and simple syntax, Tkinter enables quick creation and iteration of interfaces. Perfect for prototyping ideas or building small tools and utilities.\n- **Integration with Python Ecosystem:**
Tkinter integrates seamlessly with other Python libraries—whether it’s matplotlib for charts, pandas for data manipulation, or sqlite3 for databases—making it ideal for building full-featured applications.\n- **Customisable UI with Themes:**
Using the ttk (themed Tkinter) module, developers can create modern-looking applications. You can apply different styles, fonts, and colours—or use theme libraries to drastically improve the visual design.\n\n
\n\n### **Core Components of a Tkinter Application**\nTo build an effective GUI in Tkinter, it's essential to understand its core building blocks. \n\nHere's a deeper dive into the foundational elements of any Tkinter app:
\n**1. Windows and Frames**\n- **Root Window (Tk())**: This is the main window of your application—your starting point.\n- **Top-level Windows**: These are additional pop-up windows that can be created when needed.\n- **Frames**: Frames are container widgets that help group and organize other widgets. Using frames improves the modularity and layout of your UI.\n\n**2. Widgets: Building Blocks of the UI**
\nWidgets are the interactive elements users can see and use. Tkinter includes a rich set of widgets, such as:\nLabel: Displays text or images.\n\n- **Label:** Displays text or images.\n- **Button:** Triggers an action when clicked.\n- **Entry:** Single-line text input.\n- **Text:** Multi-line text area.\n- **Checkbutton:** Toggle options.\n- **Radio button:** Select one among multiple options.\n- Listbox, Canvas, Scrollbar, Menu, and more.\n\n\n**3. Layout Managers: Organising the Interface**\nTkinter provides **three layout managers** to control how widgets appear inside their containers:\n- **Pack:** Stacks widgets vertically or horizontally.\n- **Grid:** Organises widgets in a table-like structure using rows and columns.\n- **Place:** Allows exact positioning using x and y coordinates.
\n\n**4. Event Handling: Making Apps Interactive**\nAt the heart of any GUI is **event-driven programming.** Tkinter supports:\n- **Button clicks**\n- **Keyboard input**\n- **Mouse movement and clicks**\n- **Window events (e.g., close, resize)**\n\n **5. Additional Features (Advanced Use Cases)**\n- **Canvas for Graphics:** Draw shapes, images, and custom visuals.\n- **Menus and Toolbars:** Add dropdown menus and toolbars for navigation.\n- **Dialogues and Message Boxes:** Use tkinter.messagebox and tkinter.filedialog for user interaction.\n- **Multithreading:** Prevent UI freezing during long tasks using threading or after() method.\n- **Themed Widgets:** Use ttk for consistent and modern widget styles.\n- **Custom Widgets:** You can create your own composite widgets by subclassing existing ones.\n\n
\n\n**Conclusion**
\nTkinter is an excellent choice for developers who want to create GUI applications with Python. Its simplicity, cross-platform compatibility, and integration with Python make it a powerful tool for building interactive and visually appealing applications. By understanding the basic components of Tkinter and how they work together, you can unlock endless possibilities for creating user-friendly applications. In future blog posts, we will explore various Tkinter widgets, layout management techniques, event handling, and more advanced topics to further enhance your Tkinter skills. Stay tuned! Remember, the key to mastering Tkinter lies in practice. So, roll up your sleeves, start coding, and dive into the world of Tkinter GUI development. Happy coding!\n\n\n\n\n\n\n\n\n","blog_slug":"introduction-to-tkinter-a-beginner-s-guide","published_date":"12th May 2025"},{"title":"Building GUI Applications with Tkinter","Descrption":"## **Introduction to Building GUI Applications with Tkinter**\n**Graphical User Interfaces (GUIs)** play a crucial role in modern software development by enhancing user experience and making applications more intuitive. Among the many tools available in Python, **Tkinter** stands out as a built-in, easy-to-use, and robust library for creating GUI applications. In this post, we will explore the complete process of building GUI applications using Tkinter. We'll walk through essential concepts, the fundamental structure of a Tkinter program, and provide a hands-on example to solidify your understanding.\n\n## **Setting up the Tkinter Environment:**\nBefore we dive into building graphical interfaces, it's important to ensure your development environment is properly set up. One of the biggest advantages of Tkinter is that **it comes bundled with Python**, so there's no need to install it separately.
\nAs long as you have Python installed (preferably version 3.x), Tkinter should already be available on your system. To verify this, you can open a Python shell and type:
\n```\nimport tkinter\nprint(tkinter.TkVersion)\n```\n\n### **The Basic Structure of a Tkinter Application:**\nTkinter applications follow a consistent structural pattern that makes it easier to build and scale projects. Below is a step-by-step breakdown of the typical workflow when developing a Tkinter GUI:\n\n**1. Importing the Tkinter Module:** \nThe first step in any Tkinter application is to import the module. It's a common convention to import Tkinter using the alias tk for convenience:
\n\n`import tkinter as tk`\n\n**2. Creating the Application Window:** Every Tkinter app begins with a main window, which serves as the root container for your GUI components. This is done by creating an instance of the Tk() class:
\n\n`window = tk.Tk()`\n\nYou can further customize the window’s title, size, and icon:\n\n```\nwindow.title(\"My First Tkinter App\")\nwindow.geometry(\"400x300\")\n```\n\n**3. Adding Widgets:** Widgets are the building blocks of a GUI. Tkinter provides a wide variety of widgets to choose from—such as Label, Button, Entry, Checkbutton, Radiobutton, Text, and more.
\nFor example, to add a welcome message:\n```\nlabel = tk.Label(window, text=\"Welcome to Tkinter!\")\nlabel.pack()\n```\nThe pack() method places the widget inside the window using the **Pack geometry manager**, which automatically arranges widgets in blocks.\n\n**4. Configuring Widget Properties:** Tkinter widgets are highly customizable. You can change properties like font style, size, background color, and more using either constructor arguments or the .config() method:
\n\n`label.config(fg=\"blue\", font=(\"Helvetica\", 14))`\n\nYou can also assign functionality, such as linking a button to a function:\n\n```\nbutton = tk.Button(window, text=\"Click Me\", command=my_function)\nbutton.pack()\n```\n\n**5. Handling Events:** Interactivity is what makes GUI applications come to life. Tkinter supports event-driven programming, allowing you to respond to user actions like:\n- Button clicks\n- Key presses\n- Mouse movement or clicks\n- Window closing\n\nThere are two primary ways to handle events:\n1. **Using the command parameter** for buttons and similar widgets:\n```\ndef greet():\n print(\"Hello!\")\n\ntk.Button(window, text=\"Greet\", command=greet).pack()\n```\n2. **Using the bind() method** to attach custom functions to events:\n```\ndef on_key(event):\n print(f\"Key pressed: {event.char}\")\n\nwindow.bind(\"
\n\n`window.mainloop()`\n\nThis line keeps the window open, listens for events, and updates the UI as needed. Without it, the window would open and immediately close.\n\n### **Example Application: Creating a To-Do List** \n\nTo demonstrate all of the above concepts, let’s build a simple **To-Do List** application using Tkinter. This small project covers core functionalities like adding tasks and updating the interface based on user actions.\n\n**Step-by-step implementation:**\nBelow is an example (assuming you’ve created and saved a file named todo.py):\n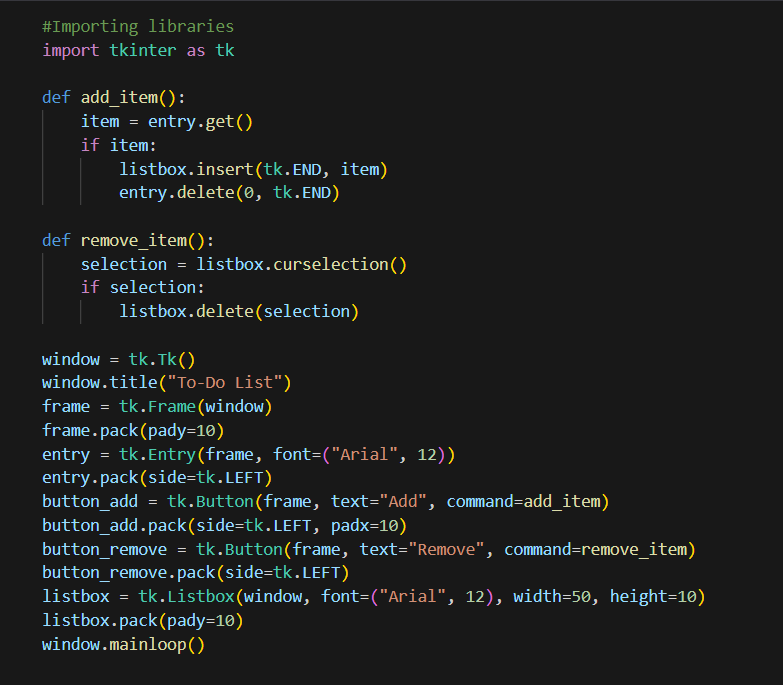\n\n\n### **Conclusion:**\n\nTkinter provides a versatile and user-friendly framework for building GUI applications in Python. By following the basic structure and understanding the concepts of widgets, event handling, and layout management, you can create interactive and visually appealing applications.\n\nwe explored the process of building GUI applications using Tkinter, from setting up the environment to creating a simple to-do list application. Remember to experiment, explore the Tkinter documentation, and leverage the vast range of widgets and customization options available.\n\nNow it's your turn to dive into Tkinter and unleash your creativity in building powerful GUI applications. Happy coding!\n","blog_slug":"building-gui-applications-with-tkinter","published_date":"20 May 2025"},{"title":"The Importance of SQL in Today's World: A Fundamental Data Manipulation Language","Descrption":"#### Introduction\nIn today's technologically advanced world, the importance of effective data management cannot be overstated. As vast amounts of data are generated every second, organizations and individuals rely on robust systems to store, retrieve, and manipulate data efficiently. Among the various tools available, SQL (Structured Query Language) stands as a foundational language for managing relational databases. we will examine why SQL is still essential in today's world, even with the emergence of newer data management technologies.\n\n1. **Ubiquitous Relational Databases (Relational databases that are widely used):** Relational databases are the backbone of countless applications, powering industries ranging from finance to healthcare and beyond. SQL offers a standardized language for interacting with these databases, enabling organizations to handle their data consistently and efficiently. Despite the emergence of NoSQL databases and other data storage technologies, SQL remains a fundamental skill for professionals working with structured data.\n2. **Data Integrity and Consistency:** One of the primary reasons for SQL's continued importance is its ability to maintain data integrity and ensure consistency. SQL enforces strict data constraints and provides mechanisms such as transactions and ACID (Atomicity, Consistency, Isolation, Durability) properties, guaranteeing the reliability of data operations. In critical domains like finance and e-commerce, where accuracy and consistency are paramount, SQL's robustness is invaluable.\n3. **Powerful Data Manipulation Capabilities:** SQL offers a wide array of commands and functions for querying, modifying, and analysing data. Its declarative nature allows users to focus on what they want rather than how to get it, making complex queries more manageable. SQL's versatility extends to aggregating data, performing calculations, and generating insightful reports, making it an essential tool for business intelligence and data analysis.\n4. **Seamless Integration and Compatibility:** SQL's compatibility with various programming languages and database management systems (DBMS) is another compelling reason for its continued importance. Whether it's Java, Python, or .NET, SQL integrates seamlessly with popular programming languages, allowing developers to harness the power of databases within their applications. Furthermore, SQL is supported by numerous DBMS, including Oracle, MySQL, and Microsoft SQL Server, ensuring broad applicability and ease of adoption.\n5. **Scalability and Performance Optimization:** With the exponential growth of data, scalability and performance optimization have become critical concerns. SQL provides mechanisms such as indexing, query optimization, and data partitioning, enabling efficient data retrieval and manipulation, even with large datasets. By leveraging SQL's optimization capabilities, organizations can enhance the performance of their applications and ensure responsiveness to user demands.\n6. **Data Security and Access Control:** In an era marked by privacy concerns and stringent data protection regulations, SQL shines in terms of security and access control. SQL allows for fine-grained access management, enabling organizations to control who can access, modify, or delete data. By implementing SQL's security features, businesses can protect sensitive information and mitigate the risk of data breaches.\n\n#### Conclusion\nDespite the advent of new data management technologies, SQL remains an indispensable tool for managing relational databases efficiently. Its prevalence, data integrity capabilities, powerful manipulation capabilities, compatibility, scalability, performance optimization, and security features contribute to its continued importance in today's world. Professionals across various domains benefit from SQL's versatility, making it a skill worth mastering in an era driven by data-driven decision-making and analytics.\nSo, whether you're a developer, analyst, or aspiring data professional, understanding and harnessing the power of SQL will undoubtedly enhance your ability to navigate the ever-expanding data landscape effectively.\n","blog_slug":"the-importance-of-sql-in-today-s-world-a-fundamental-data-manipulation-language","published_date":"17 July 2023"},{"title":"\"Tkinter Explorations: Building Intuitive GUIs\"","Descrption":"### Introduction\n\nTkinter, a Python library for GUI development, offers a wide range of widgets that allow you to create\ninteractive and visually appealing applications. we will explore some of the most commonly used widgets in\nTkinter: Buttons, Labels, and Entry Fields. We'll cover their usage, customization options, and practical\nexamples to help you get started with Tkinter widget development.\n\nLayout management plays a crucial role in creating well-organized and visually appealing GUI applications.\nTkinter, a popular Python library for GUI development, offers three main layout managers: Pack, Grid, and\nPlace. In this blog post, we will explore these layout managers, their differences, and when to use each one to\nachieve optimal control over the positioning and arrangement of widgets in Tkinter.\n\nFrames and menus are essential components in Tkinter for creating organized and intuitive graphical user\ninterfaces (GUIs). Frames provide a way to group and organize widgets, while menus offer a means of\nincorporating dropdown menus and adding functionality to your application. In this blog post, we will explore\nhow to work with frames and menus in Tkinter to enhance the structure and functionality of your GUI\napplications.\n\n**Exploring Tkinter Widgets: Buttons, Labels, and Entry Fields**\n\n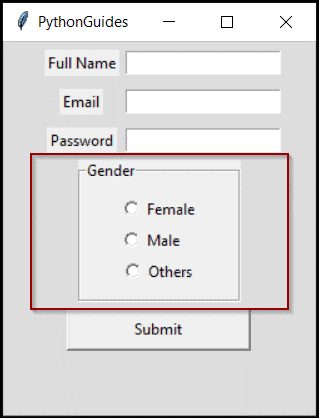\n\n\n**Buttons:** Buttons are essential components of any GUI application. They provide a means for users to interact\nwith the application and trigger specific actions. Tkinter offers a variety of button types, including regular\nbuttons, image buttons, and toggle buttons.\n\n**Here's an example of creating and customizing a button:**\n\n\n\n\n**Labels:** Labels are used to display static text or images in a GUI application. They are typically used to provide\ninformation, headings, or captions within the user interface. Tkinter labels can be customized with various\nproperties, such as font, color, and alignment.\n\n**Here's an example:**\n\n\n\n\n**Entry Fields:** Entry fields, also known as text input fields, allow users to enter and edit text within the GUI\napplication. Tkinter provides the **Entry** widget for this purpose. You can customize entry fields with properties\nsuch as width, font, and validation options.\n\n**Here's an example:**\n\n\n\n\n### Layout Management in Tkinter: Pack, Grid, and Place\n\n\n\n\n**1. Pack Layout Manager:** The Pack layout manager is the simplest and most commonly used layout\nmanager in Tkinter. It organizes widgets in a top-to-bottom or left-to-right fashion, stacking them in a\nsingle column or row.\n\n**Here's an example of using the Pack layout manager:** \n\n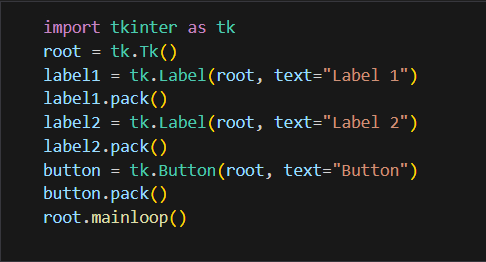\n\n\nIn this example, the **pack()** method is called on each widget to pack them vertically one after another.\nThe Pack layout manager adjusts the size of each widget based on its content and the available space.\n\n**2. Grid Layout Manager:** The Grid layout manager provides a grid-based layout system, allowing\nwidgets to be placed in rows and columns. It offers more control over the positioning and alignment of\nwidgets compared to the Pack manager.\n\n**Here's an example of using the Grid layout manager:**\n\n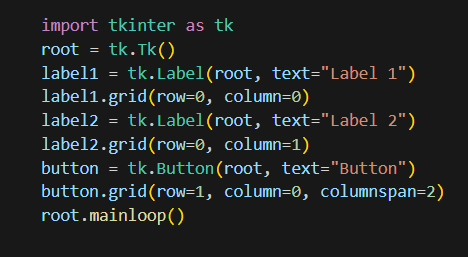\n\n\nIn this example, the **grid()** method is used to specify the row and column positions of each widget. The\nrow and column parameters define the grid coordinates. Additional parameters, such as column span\nand row span, can be used to span multiple columns or rows, respectively.\n\n**3. Place Layout Manager:** The Place layout manager allows precise control over the positioning and size\nof widgets by specifying their coordinates in the parent widget. This layout manager is less commonly\nused but can be useful for specialized scenarios.\n\n**Here's an example of using the Place layout manager:**\n\n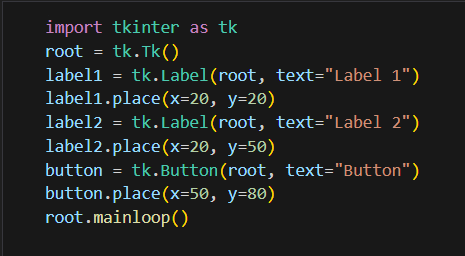\n\n\nIn this example, the **place()** method is used to specify the exact coordinates (x and y) of each widget\nwithin the parent widget. You have full control over the widget's position and size using this layout\nmanager.\n\n### Working with Frames and Menus in Tkinter\n\n\n\n\n**Working with Frames:** Frames in Tkinter act as containers that help organize and group widgets together.\nThey provide a way to logically partition the interface and manage widgets as a cohesive unit.\n\nHere's an example of working with frames in Tkinter:\n\n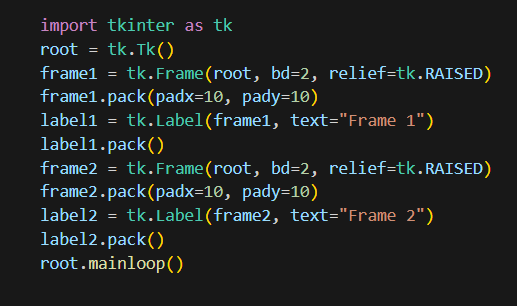\n\n\nIn this example, we create two frames, frame1, and frame2, using the Frame class. We specify the parent\nwidget (root in this case) and additional properties such as bd (border-width) and relief (border style). Widgets\ncan then be added to each frame using methods like pack(), grid(), or place().\n\n**Working with Menus:** Menus provide a way to incorporate dropdown menus into your Tkinter application,\nenabling users to access various actions and functionality. Tkinter supports two types of menus: Menus and\nMenu button.\n\n**Here's an example of working with menus in Tkinter:**\n\n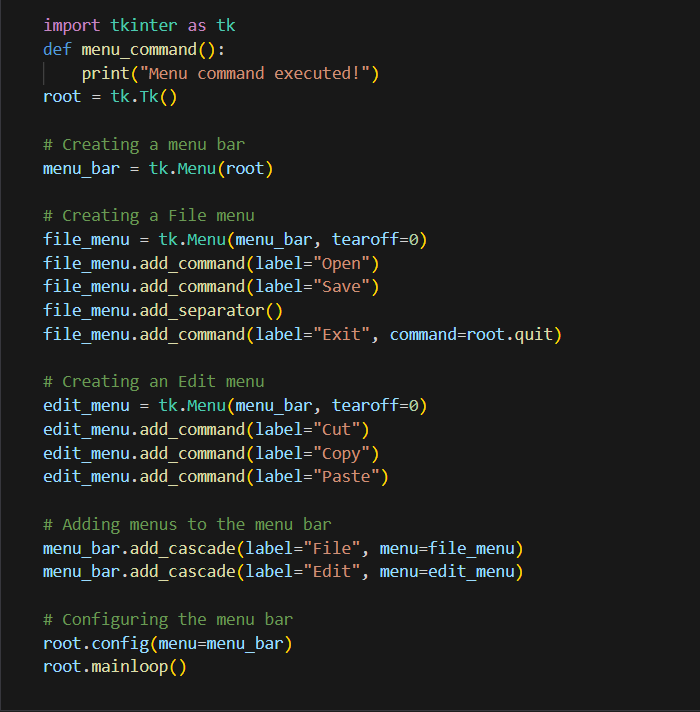\n\n\nIn this example, we create a menu bar using the Menu class and assign it to the menu_bar variable. We then\ncreate individual menus (File and Edit) using the Menu class and add commands and separators using the\nadd_command() and add_separator() methods. Finally, we use the add_cascade() method to add the menus\nto the menu bar, and the config() method to configure the menu bar for the root window.\n\n### Conclusion\nTkinter offers a rich collection of widgets that empower you to build interactive and visually appealing GUI\napplications. In this blog post, we explored some of the fundamental widgets: Buttons, Labels, and Entry\nFields. By understanding their usage and customization options, you can create engaging user interfaces\ntailored to your application's needs.\n\nLayout management is an essential aspect of GUI development in Tkinter. By understanding the differences\nbetween the Pack, Grid, and Place layout managers, you can choose the appropriate one for your application\nbased on your requirements.\n\nThe Pack Manager is ideal for simple layouts where widgets are stacked vertically or horizontally. The Grid\nThe manager offers a flexible grid-based layout for more complex arrangements, allowing precise control over\npositioning. The Place manager provides absolute control over widget placement but requires careful\nconsideration and may be best suited for specialized scenarios.\n\nFrames and menus are powerful tools for organizing and enhancing the functionality of GUI applications in\nTkinter. Frames allow you to group and manage widgets efficiently, while menus provide dropdown\nfunctionality and access to various actions. By incorporating frames and menus into your Tkinter applications,\nyou can create visually appealing and user-friendly interfaces.\n\nRemember to experiment, explore the Tkinter documentation, and leverage the vast range of properties and\nmethods available for each widget. As you learn more about Tkinter, you'll discover even more widgets and\nadvanced techniques to enhance your GUI development skills.\n\nIn this blog post, we explored the Tkinter Widgets, Layout Management in Tkinter, and working with frames\nand menus in Tkinter. Experiment with different configurations, properties, and functionality to customize\nyour GUI applications according to your requirements. Be sure to explore the Tkinter documentation for more\nadvanced features and additional options to further enhance your applications.\n\nNow, armed with the knowledge of Tkinter Widgets, Layout Management in Tkinter, frames, and menus,\ngo ahead and create robust and interactive GUI applications using Tkinter. Happy coding!","blog_slug":"tkinter-explorations-building-intuitive-gu-is","published_date":"07 August 2023"},{"title":"Using Python Tkinter with Databases: SQLite and MySQL Integration Made Easy","Descrption":"#### **Introduction**\nIn modern software development, working with databases is a common requirement. Tkinter, the popular GUI toolkit for Python, provides seamless integration with databases, allowing developers to build powerful applications with data persistence. In this blog post, we will explore how to use Tkinter with two widely used databases: SQLite and MySQL. We will cover the basics of database integration, performing CRUD operations (Create, Read, Update, Delete), and displaying data in Tkinter GUI applications.\n\n1. **Understanding Database Integration in Tkinter:** Before we dive into the specifics, let's first understand the concept of database integration in Tkinter. Tkinter provides the necessary modules and functions to connect to databases, execute SQL queries, retrieve data, and update records. The two databases we will focus on are SQLite, a lightweight and file-based database, and MySQL, a robust and widely adopted relational database management system.\n\n2. **Working with SQLite in Tkinter:** SQLite is ideal for small to medium-sized applications and projects. We will explore how to create an SQLite database, establish a connection from Tkinter, execute SQL queries to create tables and insert data, retrieve and display records in Tkinter widgets such as Listboxes or Treeviews, and update or delete records using user interactions.\n\n3. **Integrating MySQL with Tkinter:** MySQL is a popular open-source database management system used in various enterprise-level applications. We will discuss the process of connecting Tkinter with a MySQL database using MySQL.connector module. This includes establishing a connection, executing SQL queries, fetching and displaying data in Tkinter widgets, and performing update and delete operations on MySQL records.\n\n4. **Designing User-friendly Database Forms:** To enhance the user experience, we will delve into the design of user-friendly database forms in Tkinter. We will discuss techniques for creating input fields, labels, buttons, and other widgets to facilitate data entry and manipulation. Additionally, we will cover form validation, error handling, and feedback mechanisms to ensure data integrity.\n\n5. **Implementing CRUD Operations:** CRUD (Create, Read, Update, Delete) operations are fundamental to working with databases. We will demonstrate how to implement these operations in Tkinter using SQLite and MySQL. You will learn how to create new records, retrieve existing data, update records, and delete entries from the database, all within a Tkinter application.\n\n6. **Handling Exceptions and Errors:** Database operations are not immune to errors or exceptions. We will discuss error-handling strategies and techniques to gracefully handle exceptions that may occur during database interactions. By implementing proper error-handling mechanisms, you can provide a more robust and reliable user experience.\n\n7. **Best Practices and Performance Considerations:** We will conclude the blog post with some best practices and performance considerations for using Tkinter with databases. This includes optimizing queries, managing database connections efficiently, and securing sensitive data. These practices will help you develop scalable and high-performing database-driven Tkinter applications.\n\n#### **Conclusion** \nIntegrating Tkinter with databases like SQLite and MySQL opens up a world of possibilities for building data-centric GUI applications. With the ability to create, read, update, and delete records, you can empower users to interact with data seamlessly. By following the techniques and guidelines discussed in this blog post, you will be well-equipped to leverage the power of Tkinter and databases to create robust and feature-rich applications.\n\nRemember, database integration is a vast topic, and there is always more to explore and learn. So, take this knowledge as a starting point and continue to expand your skills in Tkinter and database programming to unlock even more potential in your Python GUI applications.\n","blog_slug":"using-python-tkinter-with-databases-sq-lite-and-my-sql-integration-made-easy","published_date":"14 August 2023"},{"title":"A Step-by-Step Guide to Installing PyCharm","Descrption":"#### Introduction\n\nPyCharm is a powerful integrated development environment (IDE) specifically designed for Python programming. Its user-friendly interface, advanced features, and seamless integration with popular Python libraries make it a favorite among developers. we will walk you through the process of installing PyCharm on your system, whether you're using Windows.\n\n**Prerequisites**\n\nBefore you begin, make sure you have the following prerequisites:\n\n1. A computer running Windows, macOS, or Linux.\n2. A stable internet connection.\n3. Basic knowledge of your operating system's file management.\n\n**Step 1: Downloading PyCharm**\n\nTo get started, follow these steps to download PyCharm:\n\n1. Open your web browser and navigate to the official PyCharm website: https://www.jetbrains.com/pycharm/. \n\n \n \n\n2. Click on the **\"Download\" ⮋** button to access the download page.\n3. If your fresher choose **Community** is free and open-source\n4. Choose the edition of PyCharm you want to install (Community or Professional) and click the corresponding \"Download\" button.\n\n**Step 2: Installing PyCharm**\n\nThe installation process may vary slightly depending on your operating system.\n\n**Windows:**\n\n1. Locate the downloaded setup file (e.g., **pycharm-community-2023.2.exe**) and double-click on it.\n\n Click on the Downloaded file\n\n Getting Started:\n\n \n\n\n Click on **Next**\n\n2. The installation wizard will appear. Follow the on-screen instructions.\n\n3. Choose the installation location or keep the default, and then select any additional components you want to install.\n\n \n\n\n Choose the **Destination Folder 📁** and **Next**\n\n4. Installation Option:\n\n \n\n\n **Thick ✔ **all the boxes and **Next**\n\n5. Selecting Start Menu Folder:\n\n \n\n\n Click on **Install**\n\n6. Processing Installation:\n\n \n\n\n After completion Click on **Next** \n\n7. Finished Installation:\n\n \n\n\n It’s better to choose **Reboot now** otherwise Choose **I want to manually reboot later** Click on the **Finish**\n\n8. Once installed, you can launch PyCharm from the Start menu or desktop shortcut.\n9. Getting Done with License Agreement:\n\n\n \n \n\n Thick ✔ and **Continue**\n\n**Step 3: Setting Up PyCharm**\n\nAfter launching PyCharm for the first time, you'll need to perform some initial setup:\n\n1. Choose the UI theme and keymap that you prefer.\n2. Create or log in to your JetBrains account (optional but recommended for accessing additional features).\n3. Configure your Python interpreter: You can either use a system interpreter or create a virtual environment.\n\n**Step 4: Exploring PyCharm**\n\nNow that PyCharm is installed and set up, take some time to explore its features:\n\n1. Project creation: Create a new Python project or open an existing one.\n2. Code editing: Write, edit, and format Python code with intelligent code completion and analysis.\n3. Version control: Integrate Git or other version control systems for collaborative development.\n4. Debugging: Set breakpoints, inspect variables, and debug your code with ease.\n5. Package management: Install, update, and manage Python packages using the built-in package manager.\n\n**References:**\n \nPyCharm: the Python IDE for Professional Developers by JetBrains : https://www.jetbrains.com/pycharm/\n\nHow to install Python Pycharm on Windows? - GeeksforGeeks : https://www.geeksforgeeks.org/how-to-install-python-pycharm-on-windows/#practice\n\n**Conclusion:**\n\nCongratulations! You've successfully installed PyCharm, a versatile IDE that empowers you to write, debug, and manage Python code efficiently. With its powerful features and user-friendly interface, PyCharm is an essential tool for both beginners and experienced developers. Start exploring its capabilities and watch your Python development workflow become smoother and more productive. Happy coding!\n\n\n\n","blog_slug":"a-step-by-step-guide-to-installing-py-charm","published_date":"19 August 2023"},{"title":"Creating a Debug Configuration to Run Code in PyCharm","Descrption":"#### Introduction\nDebugging is an essential skill for every programmer. It allows you to identify and fix issues in your code, resulting in more efficient and reliable software development. PyCharm, a popular integrated development environment (IDE) for Python, offers powerful debugging tools that can significantly enhance your development process. In this blog post, we'll walk you through the process of creating a debug configuration in PyCharm to run and debug your Python code effectively.\n\n**Step-by-Step Guide to Creating a Debug Configuration in PyCharm:**\n\n**1. Open Your Project in PyCharm**\n\nLaunch PyCharm and open your Python project. Make sure you have the project files loaded and visible in the IDE.\n\n\n\n\n**2. Navigate to Run/Debug Configurations**\n\nIn the top-right corner of the PyCharm window, you'll find a dropdown menu with a green play button labeled \"Edit Configurations.\" Click on it to open the Run/Debug Configurations dialog.\n\n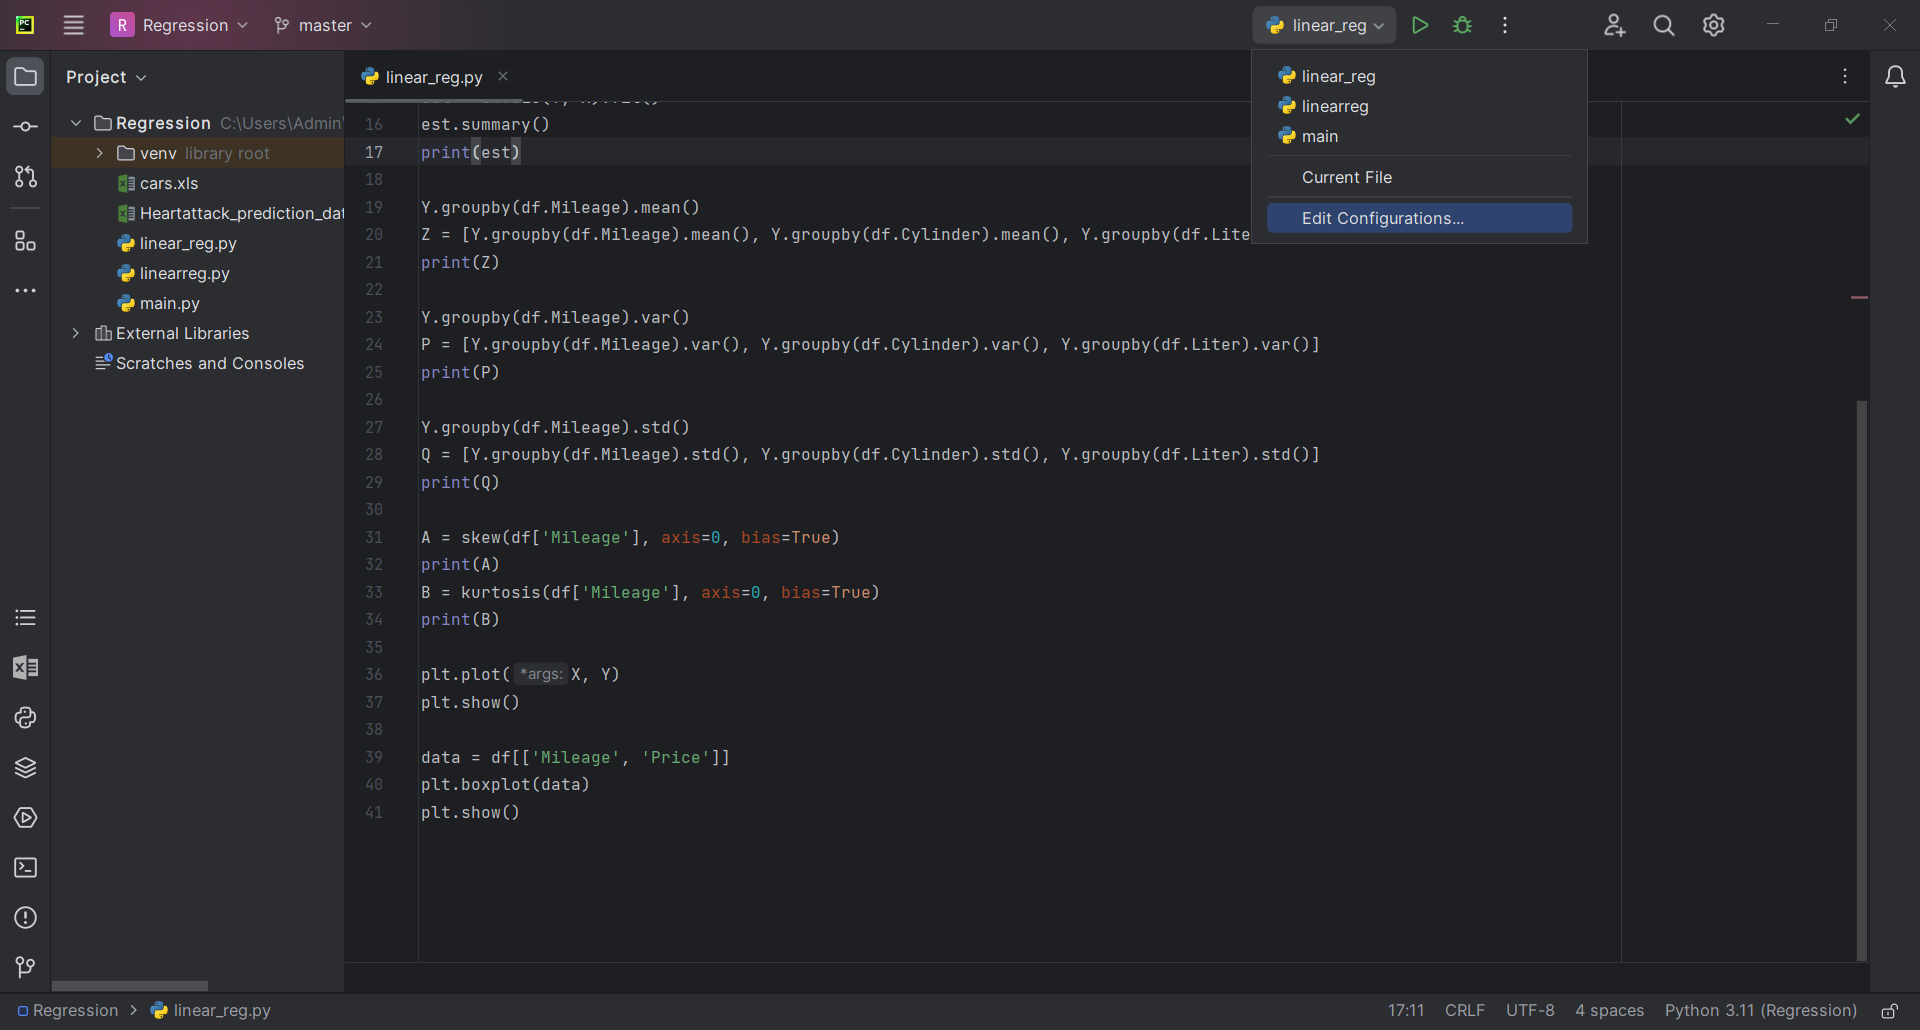\n\n\n**3. Add a New Configuration**\n\nIn the Run/Debug Configurations dialog, click the \"+\" button (Add Configuration) on the top-left corner and select \"Python\" from the dropdown menu.\n\n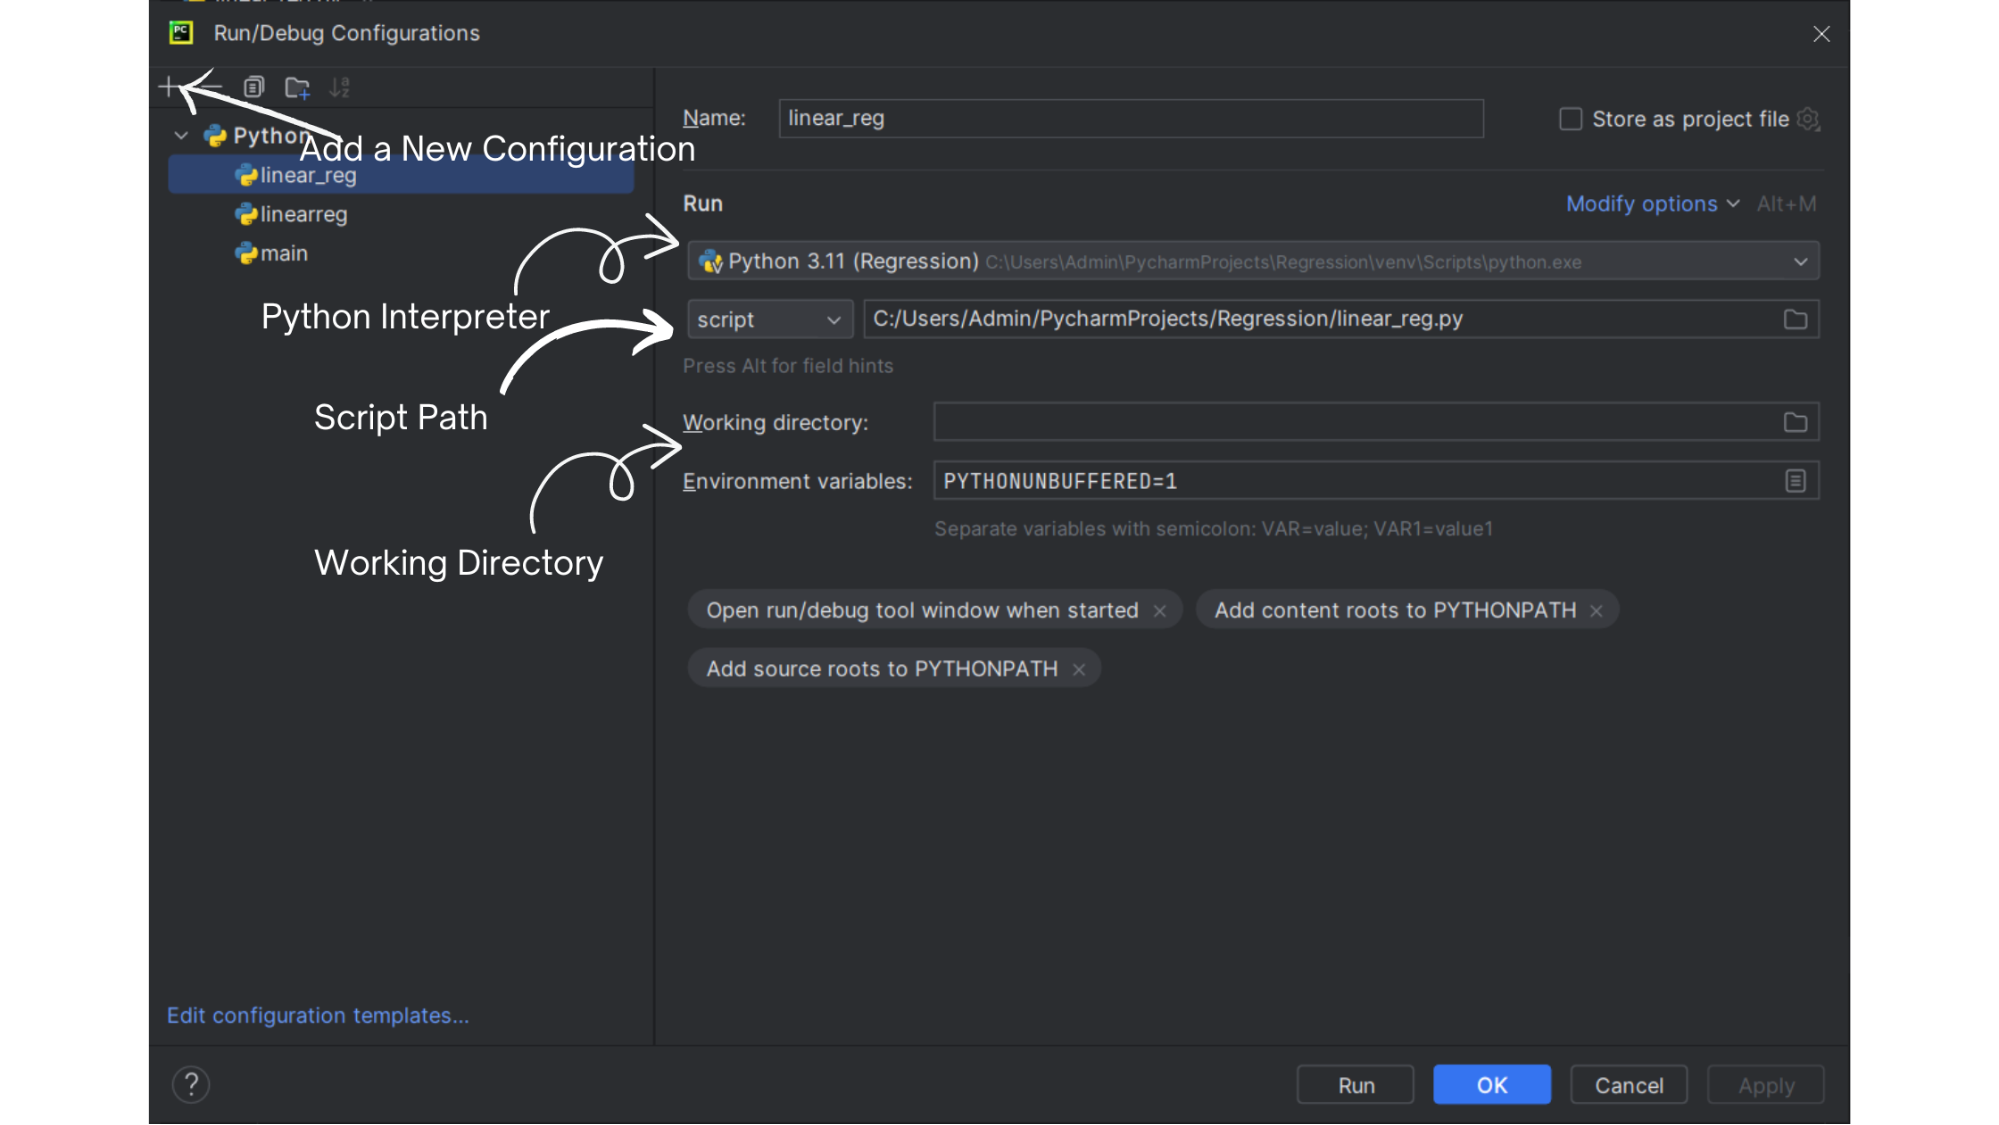\n\n\n**4. Configure Script Path and Working Directory**\n\nIn the newly created Python configuration, you'll see fields for configuring your debug settings. Provide the path to the Python script you want to debug by clicking the \"...\" button next to the \"Script path\" field. Also, set the working directory if your script relies on specific file paths or resources.\n\n**5. Set Interpreter**\n\nChoose the Python interpreter you want to use for debugging. You can select an existing interpreter or create a virtual environment for your project.\n\n**6. Configure Debugger Options**\n\nUnder the \"Debugger\" section, you can fine-tune your debugging experience. You can set breakpoints, enable/disable different types of exceptions, and choose how the debugger behaves.\n\n**7. Add Additional Run/Debug Options (Optional)**\n\nIf your script requires command-line arguments, environment variables, or any other custom configurations, you can add them under the \"Additional Options\" section.\n\n**8. Apply and Save Configuration**\n\nClick the \"Apply\" button to save your configuration changes. You can also provide a name for your configuration so you can easily identify it later.\n\n**9. Start Debugging**\n\nWith your debug configuration set up, you can now start debugging your code. Place breakpoints in your code by clicking in the left gutter of the editor. Then, click the green play button or press the \"Shift + F9\" shortcut to start debugging.\n\n**10. Debugging Workflow**\n\nAs your code runs in debug mode, you'll have access to various debugging tools, including stepping through code (F8/F7), inspecting variables, and evaluating expressions. Utilize these tools to identify and resolve issues in your code.\n\n**11. Analyze and Fix Issues**\n\nAs you step through your code, you can analyze variable values, identify logic errors, and pinpoint the source of bugs. Make necessary adjustments to your code and continue debugging until the issue is resolved.\n\n**12. End Debugging Session**\n\nOnce you've successfully debugged your code and resolved the issues, you can end the debugging session by clicking the red square \"Stop\" button in the PyCharm toolbar.\n\n#### Conclusion\nCreating a debug configuration in PyCharm is a straightforward process that can significantly improve your Python development workflow. By setting up a debug configuration, you gain access to powerful debugging tools that help you identify and fix issues in your code efficiently. With the ability to set breakpoints, inspect variables, and step through code, PyCharm empowers you to write more reliable and high-quality Python applications.\n\nRemember that effective debugging is a skill that improves over time with practice. By mastering PyCharm's debugging capabilities, you'll become a more proficient developer capable of producing cleaner and more maintainable code. Happy debugging!","blog_slug":"creating-a-debug-configuration-to-run-code-in-py-charm","published_date":"21 August 2023"},{"title":"Python’s OOP Revolution","Descrption":"Welcome to the world of Python, where simplicity meets power. we embark on a journey into one of the core pillars of Python programming - Object-Oriented Programming (OOP). OOP is a programming approach that mirrors real-world entities and their interactions, making it a powerful tool for structuring code. Let's unravel the intricacies of Python's OOP concepts.\n\nThink of OOP as a lens through which you view the real world. Imagine objects like cars, houses, and even people. Each has its own unique characteristics (attributes) and capabilities (behaviours). Similarly, in the digital realm, objects are created using classes. These blueprints define the attributes and behaviours that all instances of the class will inherit.
\nThe Building Blocks of OOP\n\n- ### **Classes**
\nThe blueprints that define objects. They contain attributes (data) and methods (functions) that define an object’s behaviour. The prototype or blueprints from which things are made are contained in a class. It is a logical entity with certain characteristics and functions.
\n\n***Some points on Python class:***\n1. Classes are created by keyword class.\n2. Attributes are the variables that belong to a class.\n3. Attributes are always public and can be accessed using the dot (.) operator. \n\n- ### **Objects**
\nInstances of a class, with their own set of attributes and methods. Think of them as specific cars, houses, or people, each with unique characteristics. The object is an entity that has a state and behaviour associated with it. Any physical thing, such as a mouse, keyboard, chair, table, pen, etc., might be it.Integers, strings, floating-point numbers, even arrays, and dictionaries, are all objects.\n\n- ### **Attributes
**\nThe data that defines an object's state. \nThese are like the color of a car, the number of bedrooms in a house, or the age of a person.\n\n- ### **Self**
\n\nThe data that defines an object's state. These are like the color of a car, the number of bedrooms in a house, or the age of a person. In Python, the instance of the class that is now being used is referred to as the \"self\" when working with classes. \"self\" is typically used as the first parameter in class instance methods. Whenever you call a method of an object created from a class, the object is automatically passed as the first argument using the “self” parameter.\n\n- ### class Dog:\n\tdef __init__(self, name,age)\n\tself.name = name\n\tself.age = age\n\tdef bark(self)\n\t\treturn f”{self.name} says woof!”\nmy_dog = Dog(name=’Buddy”, age=30)\nprint(my_dog(bark())\n\n\n***Example: -***\n\nWe defined a Dog class with a constructor (__init__) to initialise its attributes (name and age). The bark method represents the behaviour of the Dog class.\n\n### **Inheritance
**\nLetting new classes take on properties and functions from older ones. Consider how a sports vehicle adds its own distinct characteristics and behaviour to the qualities of a regular car. One class's capacity to obtain or inherit properties from another class is known as inheritance. The class from which properties are derived is referred to as the base class or parent class, while the class that derives properties is referred to as the derived class or child class.\n\n***Types of Inheritance***
\n**Single Inheritance:**
\nSingle-level inheritance enables a derived class to inherit characteristics from a single-parent class.\n\n**Multilevel Inheritance:**
\nMulti-level inheritance enables a derived class to inherit properties from an immediate parent class which in turn inherits properties from his parent class. \n\n**Hierarchical Inheritance:
**\nHierarchical-level inheritance enables more than one derived class to inherit properties from a parent class.\n\n**Multiple Inheritance:
**\nMultiple-level inheritance enables one derived class to inherit properties from more than one base class\n\nclass Animal:\n def __init__(self, name):\n self.name = name\n \n def speak(self):\n pass\n\nclass Cat(Animal):\n def speak(self):\n\treturn f”{self.name} says meow!”\n\nclass Dog(Animal):\n def speak(self):\n return f”{self.name} says woof!”\n\nmy_cat = Cat(name = “Whiskers”)\nmy_dog = Dog(name = “Buddy”)\n\nprint(my_cat.speek())\nprint(my_dog.speek())\n\n\nIn the above code Cat and Dog classes inherit from the base class Animal. They override the abstract speak method to provide their own implementation.\n\n### **Polymorphism
**\nIt is possible to consider objects of various classes as belonging to the same base class thanks to polymorphism. This enhances flexibility and modularity. Polymorphism in Python refers to the ability of objects to take on multiple forms. In the context of object-oriented programming, polymorphism allows objects of different classes to be treated as objects of a common base class. This can be achieved through method overriding and the use of a common interface. Allowing objects to respond differently to the same message.\n\nclass Animal:\n def __init__(self, name):\n self.name = name\n def speak(self):\n\tpass\n\nclass Cat(Animal):\n def speak(self):\n\treturn f”{self.name} says meow!”\n\nclass Dog(Animal):\n def speak(self):\n return f”{self.name} says woof!”\n\nmy_cat = Cat(name = “Whiskers”)\nmy_dog = Dog(name = “Buddy”)\n\n def animal_sound(animal):\n\treturn animal.speak()\n\nprint(animal_sound(my_cat))\nprint(animal_sound(my_dog))\n\nThe animal_sound function takes any object that has a speech method (polymorphism). It allows us to treat both Cat and Dog objects as if they were of the same type.\n\n### **Encapsulation**
\nThe idea of encapsulation is to combine data and methods that work with the data into a single unit, or class. This protects the internal details of the object. Encapsulation in Python is a fundamental concept in object-oriented programming that involves bundling the data (attributes) and methods that operate on the data into a single unit known as a class. It restricts access to some of the object's components, providing data protection and implementation hiding. Protecting an object's data by bundling it together with its methods\n\nclass BankAccount:\n def __init__(self, balance=0):\n\tself._balance = balance\n def deposit(self, amount):\n\tself._blance += amount\n def withdraw(self, amount):\n\tif amount <= self._balance:\n self._balance -= amount\n else:\n\t print(“insufficient funds,”)\n\n def get_balance(self):\n\treturn self._balance\n\naccount = BankAccount()\naccount.deposit(1000)\naccount.withdraw(1000)\n\nprint(f”Current balance: {account.get_balance()}”)\n\n\nthe balance attribute is protected by using a single underscore (_). External access to _balance is discouraged, but it's not strictly prohibited.\n\n\n### **Advantages of OOP’s**\n\n1. **Modular Code:** Divide your code into smaller, well-defined units (classes) for improved organization and maintainability.\n3. **Code Reusability:** Share code across different objects and applications through inheritance, reducing redundancy and development time.\n5. **Scalability:** Build complex systems with ease by creating new classes that inherit and extend existing functionality.
\n7. **Maintainability:** Simplify bug fixes and updates by isolating code in specific classes, reducing the risk of unintended side effects.\n\n\n## **Conclusion**\nPython's Object-Oriented Programming concepts provide a powerful and flexible way to structure code. By understanding and leveraging these concepts, you can create well-organized, modular, and reusable code. Whether you're a beginner or an experienced developer, incorporating OOP principles into your Python programming will undoubtedly elevate your coding skills to new heights. Happy coding!\n\n","blog_slug":"python-oop-revolution","published_date":"Dec 18th"},{"title":"Control Flow in Python: Using if statements and loops","Descrption":"Control flow is a fundamental concept in programming that allows you to dictate the order in which statements are executed in your code. In Python, control flow is managed through the use of conditional statements (if statements) and loops.\n\n\n### **Conditional statements**\n\nConditional statements are used to guide a program's flow based on certain conditions. The main conditional statements include \"if,\" \"elif\" (short for \"else if\"), and \"else.\" These statements allow you to run different code blocks depending on whether a specified condition is true or false.\n\n### **Python If Statement**\n\nThe \"if\" statement stands as the most elementary decision-making construct. Its purpose is to determine the execution or omission of specific statements or a block of statements based on a given condition.\nThe \"if\" statement is employed to assess a condition. Should the condition prove to be true, the indented code block beneath the \"if\" statement is executed. Conversely, if the condition is false, the code block is bypassed.\n\n#### ***Syntax***\n\n If (Conditional expression):\n Code line 1\n Code line 2\n
\n\n## **Flow Chart**\n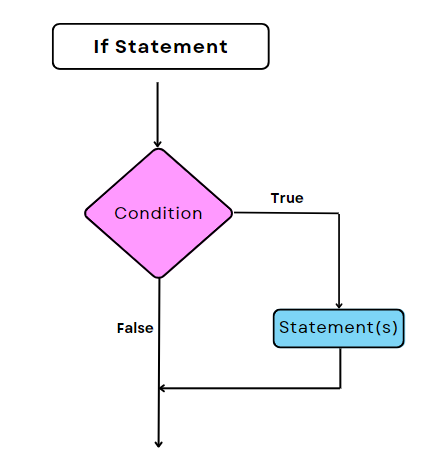 \n\n\n### *Example*\n\n\n\n### **Python If-Else Statement**\n\nThe \"if\" statement, in isolation, signifies that upon the condition being true, a designated block of statements will execute; conversely, if false, it will not. However, to introduce an alternative course of action in the event of a false condition, the \"else\" statement can be coupled with the \"if\" statement, enabling the execution of a distinct code block when the \"if\" condition is false.\n\n#### ***Syntax***\n\nif (condition):\n # Code \n # condition is true\nelse:\n # Code\n # condition is false\n
\n\n\n## **Flow Chart**\n\n\n\n### *Example*\n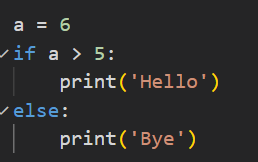\n\n\n### **Python if-elif-else Statement**\n\nThe \"if\" statements are processed in a top-down manner. Upon encountering the first true condition, the corresponding \"if\" statement's associated code is executed, and the subsequent conditions are disregarded. Should none of the conditions prove true, the concluding \"else\" statement is activated.
\nThe \"elif\" statement facilitates the sequential examination of multiple conditions. Should the condition following an \"if\" statement prove false, the subsequent \"elif\" statement is appraised. In the event that its condition is true, the associated code block is executed, and any subsequent \"elif\" or \"else\" statements are bypassed.\n\n\n#### ***Syntax***\n\nif (condition):\n Statement\nelif (condition):\n Statement\n.\n.\nelse: \n statement\n
\n\n\n## **Flow Chart**\n\n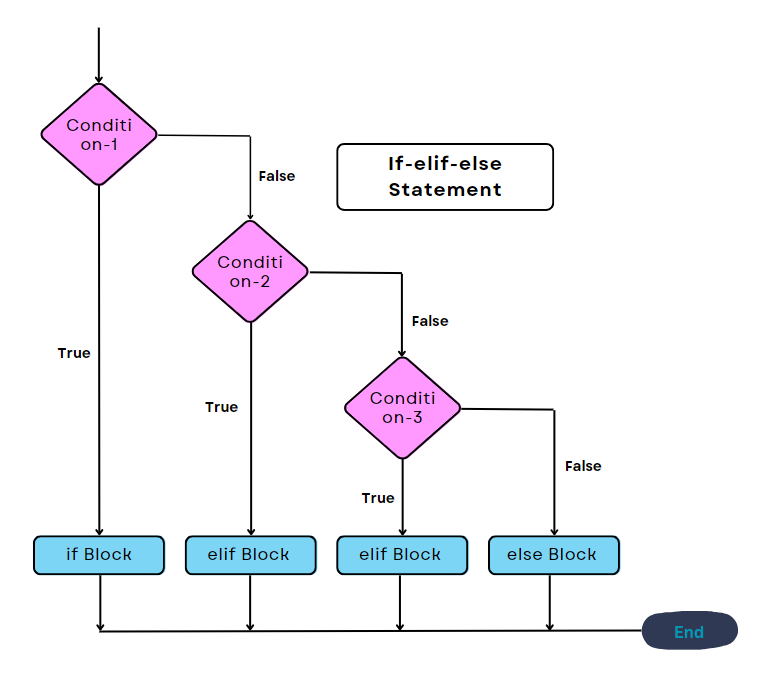\n\n\n### *Example*\n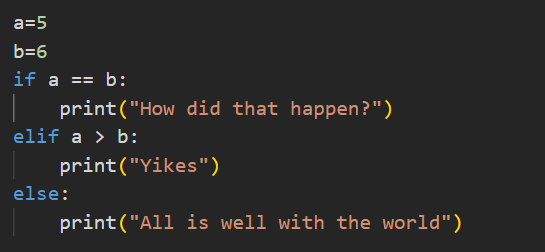\n\n\n### **Nested-If Statement in Python**\n\nA nested \"if\" is an \"if\" statement positioned within the scope of another \"if\" statement. Essentially, nested \"if\" statements entail the inclusion of an \"if\" statement within another. Python affords the capability to nest \"if\" statements, enabling the placement of an \"if\" statement inside another.\n\n\n#### ***Syntax***\n\nif (condition1):\n # Executes when condition1 is true\n if (condition2): \n # Executes when condition2 is true\n # if Block is end here\n
\n\n\n### *Example*\n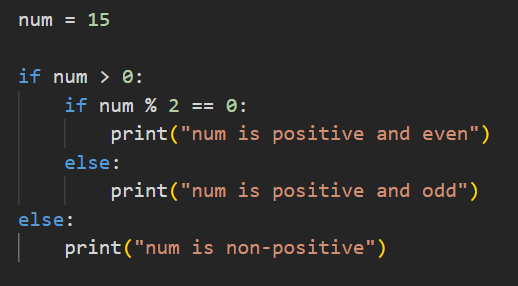\n\n\n## **Loops in Python**\n\n#### **For Loop** \n\nA for loop constitutes a control flow statement present in numerous programming languages, including Python, C, Java, and others. Its purpose is to iterate over a sequence, be it a list, tuple, string, or range, and execute a designated block of code for each item within the sequence.\n\n#### ***Syntax***\n\nfor variable in iterable:\n # code to be executed\n
\n\n- **iterable** is a sequence (e.g., a list, tuple, string, or range).\n- **variable** that takes on the value of each element in the **iterable** during each iteration.\n\nFlow chart\n\n\n### *Example*\n\n\n### **Range Function**\n\nthe range() function is often used in conjunction with loops to generate a sequence of numbers. The range() function returns an object that produces a sequence of numbers based on the specified parameters. It is commonly used in for loops.\n\n#### ***Syntax***\n\n1) for i in range(stop):\n # code to be executed\n
\n\n2) for i in range(start, stop):\n # code to be executed\n
\n\n### *Example*\n\n\n### **While loop**\n\nA while loop is employed to iteratively execute a block of statements until a specified condition is met. Upon the condition becoming false, the program proceeds to execute the line immediately following the loop.
\ncode to be executed while the condition is true
\nThis block will keep executing until the condition becomes false
\n\n#### ***Syntax***\n\nWhile expression:\n Statement(s)\n
\n\n## **Flow Chart**\n\n\n### *Example*\n\n\n\n### **Loop Control Statements**\n\n#### **Break Statement**\n\nThe break statement is used to exit the loop prematurely, regardless of whether the loop condition is True or not.\n\n### *Example*\n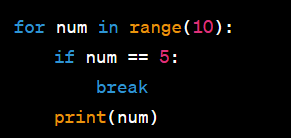\n\n#### **Continue Statement**\n\nThe continue statement is used to skip the rest of the code inside the loop for the current iteration and move to the next iteration.\n\n### *Example*\n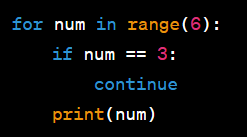\n\n### **Conclusion**\nComprehending control flow in Python, achieved through the utilization of conditional statements and loops, proves essential for crafting efficient and adaptable programs. Mastery of these concepts empowers you to imbue your code with dynamic responsiveness to varying conditions and facilitates the iteration over sequences of data. This foundational knowledge is imperative for attaining proficiency in Python programming.\n\n\n\n","blog_slug":"control-flow-in-python","published_date":"Jan 12"},{"title":"Recognizing the Wonders of Natural Language Processing (NLP) in Artificial Intelligence","Descrption":"## **Introduction**\n\nWithin the discipline of machine learning and artificial intelligence (AI), Natural Language Processing (NLP) is a dynamic and exciting area of study. NLP bridges the gap between human communication and computer comprehension by enabling machines to perceive, interpret, and produce human language. We will examine the fundamentals of natural language processing (NLP) in machines, including its main elements, uses, and underlying methods that enable it all. \n\n## *The Foundation of NLP*\n\n### **-Tokenization**
\nThe process of tokenization, which divides a sentence into smaller pieces, usually words or sub-words, is at the core of natural language processing (NLP). The first stage in transforming unprocessed text into a format that computers can comprehend and handle is called tokenization. \n\n### **-Text Representation**
\nMachine learning models require a numerical representation of words to comprehend language. Words can be turned into vectors by using methods like Word Embedding and Bag-of-Words (BOW), which capture contextual information and semantic links. For additional analysis, this numerical representation serves as the foundation. \n\n## *NLP Techniques and Models*
\n\n#### **Named Entity Recognition (NER)**
\nNER involves identifying and classifying entities within a text, such as names of people, organizations, locations, dates, and more. NER is crucial for applications like information extraction, sentiment analysis, and question-answering systems.\n\n#### **Part-of-Speech Tagging**
\nUnderstanding the grammatical structure of a sentence is essential for accurate language comprehension. Part-of-speech tagging assigns grammatical labels (e.g., noun, verb, adjective) to each word, facilitating syntactic analysis.\n\n#### **Sentiment Analysis**
\nSentiment analysis, also known as opinion mining, involves determining the emotional tone or attitude expressed in a piece of text. This application finds relevance in customer feedback analysis, social media monitoring, and market research.\n\n#### **Machine Translation**
\nIn machine translation, which translates text between languages using algorithms, natural language processing (NLP) is essential. Transformer models have greatly improved the accuracy and fluency of machine translation systems; architectures such as BERT (Bidirectional Encoder Representations from Transformers) and GPT (Generative Pre-Trained Transformer) are good examples of these models.\n\n#### **BERT (Bidirectional Encoder Representations from Transformers)**
\nBERT is designed based on the transformer architecture, introduced by Vaswani et al. in 2017. Transformers are known for their ability to capture long-range dependencies in sequences, making them effective for various NLP tasks.\n\n#### **GPT (Generative Pre-Trained Transformer)**
\nGPT, developed by OpenAI, is another transformer-based model with a focus on generative tasks. Unlike BERT, which is bidirectional, GPT is autoregressive, meaning it generates one word at a time, considering the preceding words in the sequence.\n\n#### **Comparative Strengths**
\n\n*- BERT:*
\n1. Better at capturing bidirectional context.\n2. Suited for tasks where understanding the context in both directions is crucial.\n3. Effective for tasks like sentiment analysis and named entity recognition.\n\n*- GPT:*
\n1. Excellent at generating coherent and contextually appropriate text.\n2. Suited for tasks that involve language generation and completion.\n3. Adaptable for machine translation with proper conditioning.\n\n#### **Advanced NLP Models**
\nRecurrent Neural Networks (RNNs) and Long Short-Term Memory (LSTM):\nRNNs and LSTMs are neural network architectures designed to handle sequential data, making them well-suited for NLP tasks involving context and temporal dependencies. They are fundamental in tasks like language modeling and speech recognition.\n\n#### **Transformer Architecture**
\nNLP has undergone a revolution thanks to the Transformer architecture and models like BERT and GPT. Transformers are very good at capturing long-range dependencies in language, which makes them revolutionary for tasks like text generation, language interpretation, and answering questions. \n\n## **Challenges in NLP**\nAmbiguity(It can also refer to a situation or statement that is unclear because it can be understood in more than one way ) and Context:\nHandling the ambiguity and context-dependent nature of language is one of the major issues in natural language processing (NLP). Research on resolving word sense ambiguity and comprehending context is still ongoing. \n\n## **Data Quality and Bias:**\nquality and diversity of training data are critical components of NLP models. Researchers and developers are aggressively tackling the serious problem of bias in language models.\n\n## **Future Directions**\n\n#### **1. Multimodal NLP**
\nMultimodal capabilities, or the ability for models to comprehend and produce material in a variety of modalities, such as text, graphics, and audio, are the direction that NLP is taking in the future. Expanding upon this progression, interacting with machines will become more comprehensive and human-like. \n\n#### **2. Ethical Considerations**
\nAs NLP develops, ethical issues become more and more important. Fairness, openness, and ethical AI practises are essential for the moral application of NLP technologies.\n\n## **Conclusion**\nThe dynamic field of natural language processing in machine learning is constantly changing how we engage with technology. The field of natural language processing (NLP) has advanced significantly in interpreting and processing human language, from basic tokenization to cutting-edge transformer models. The future holds even more advanced and human-like language skills, providing new opportunities for innovation and human-machine collaboration as we negotiate difficulties and ethical issues. ","blog_slug":"recognizing-the-wonders-of-nlp-in-ai","published_date":"Jan 21"},{"title":"The Essential Role of Data Types in Python Programming","Descrption":"## **Introduction**\n\nData Type are like the tools in a computer's toolbox, helping organize and work with information effectively. There are two main types: primitive, which are like the fundamental tools, and non-primitive, which are more complex and versatile. Just as a carpenter needs different tools for different tasks, computer scientists use various data type to handle different kinds of data in their programs. Understanding these types is key to creating efficient and powerful computer programs.\n\n**Python Data Type:**\n\nData types are classifications that specify which type of value a variable can hold. The interpreter uses these data types to understand how to operate on the data and how to store it in memory. \n\nGenerally, Python Data Type can be divided into two categories in computer science:\n\n#### **Primitive Data Type:**\n\nThese are the fundamental building blocks for data manipulation. They contain simple, immutable values.\n\n**Integers:-**\n\nIntegers are whole numbers that do not have any fractional or decimal parts.\nUsed to represent whole numbers from negative infinity to infinity. \nExample: -\n
\n\n**Float: -**\n\n\"Float\" stands for 'floating point number'.\nRepresent rational numbers with decimal figures\nExample: -\nA = 9\n\nB = -78
\n\n**String: -**\n\n- It’s a collection of alphabets and words or Character \n- Creating of string by enclosing with single or double Quotes. \n- Strings are immutable, meaning their values cannot be changed after they are created. Instead, operations on strings usually create new strings.\n- Strings have a length, which is the number of characters they contain.\n- Strings can be concatenated (joined together) using the + operator or specific string concatenation functions.\n- String can be accessed using indexing.\n- Strings support various manipulation operations.\n\nNote: -\n - Mutable\nExample: -\n\nC = 2.11\n\nD = -5.11
\n\n**Boolean**\n\nThis built-in data type can take up the values: True and False, which often makes them interchangeable with the integers 1 and 0. Booleans are useful in conditional and comparison expressions\n\nExample: -\nE = ‘Sameer’\n\nF = “Cookies”\n\nG = ‘10’\n\n# Python String Methods; -\n\n# Concatenation\n\nstr1 = 'Hello'\n\nstr2 = ' World's\n\nresult = str1+str2\n\nprint(result) #Output: “Hello World”\n\n# Length\n\nprint(len(result))\n\n# Substring\n\nprint(result[6:12])\n\n# Uppercase and Lowercase\n\nprint(result.upper())\n\nprint(result.lower())\n\n# Replace\n\nprint(result.replace('\n\nWorld', 'Universe'))\n\n# Find\n\nprint(result.find('Hello'))\n\n# Split\n\nstr3 = '! '\n\nresult1 = result+str3\n\nprint(result1)\n\nprint(result1.strip())\n\n# It removes the space after word\n\n“Hello World”. Capitalize ()\n\n “Hello World”. count (‘0’)\n\n“Hello World”. isdecimal ()\n\n“Hello World”. isdigit ()\n\n“Hello World”. islower ()\n\n“Hello World”. isnumaric ()
\n\n#### **Data Type Conversion in Primitive Data Type: -**\n\n- Data type conversion, also known as type casting\n- The process of converting a variable from one data type to another.\n\nBoolean Variable:\n\nis_true = True\n\nis_false = False\n\nprint(is_true) # Output: True\n\nprint(is_false) # Output: False\n\n# Boolean Expression: -\nx = 5\n\ny = 10\n\n# Comparison operators return Boolean values\n\nis_equal = x == y\n\nis_not_equal = x != y\n\nprint(is_equal) # Output: False\n\nprint(is_not_equal) # Output: True\n\n# Logical Operator: \n\na = True\n\nb = False\n\n# Logical AND\n\nresult_and = a and b\n\n# Logical OR\n\nresult_or = a or b\n\n# Logical NOT\n\nresult_not = not a\n\n# Conditional Statements:\n\nnumber = 42\n\nif number > 50:\n\n print(\"The number is greater than 50.\")\n\nelse:\n\n print(\"The number is not greater than 50.\")
\n\n### **Non-Primitive Data Type: -**\n\n**List: -**\n\n- A list is a versatile and mutable collection of elements in Python. \n\nNote:\n\n- Mutable: Elements can be added, removed, or modified after the list is created.\n\n- It is ordered, meaning the elements have a specific sequence, and it allows for the storage of various data types within the same list (Heterogeneous). \n\n- Lists are defined by enclosing comma-separated values in square brackets ([ ]).\n\nList Method: -\n# Converting Integer to float\n\na = 5\n\nb=float(a)\n\nprint('b is {} and type of b is {}'.format(b, type(b)))\n\n# Converting float to Integer\n\na = 5.0\n\na=int(b)\n\nprint('a is {} and data type of a is {}'.format(a, type(a)))\n\n# Converting Integer to String\n\na = 5\n\nb = str(a)\n\nprint(b)\n\nprint(type(b))\n\n# Converting float to String\n\na = 2.5\n\nb = str(a)\n\nprint(b)\n\nprint(type(b))\n\n# Converting String to Integer or float\n\n# When converting a string to an integer or float, the string must be a valid numerical value; otherwise, it trough’s an error like \n\n“ValueError: invalid literal for int() with base 10”\n\nc='10'\n\nd,e = int(c), float(c)\n\nprint('d is {} and e is {}'.format(d,e))\n\n# invalid conversion \n\nsa = 'sameer'\n\nsam = int(sa),float(sa)\n\nprint(sam) #ValueError: invalid literal for int() with base 10: 'sameer'
\n\n\n**Tuple: -**\n\n- A tuple is an ordered and immutable collection of elements in Python.\n- It is ordered, meaning the elements have a specific sequence, and it allows for the storage of various data types within the same list (Heterogeneous).\n- but once a tuple is created, its elements cannot be modified (Immutable). \n- Tuples are defined by enclosing comma-separated values in parentheses.\n\nExample:\na is list, a = [ 1, 2, 3]\n\na.append()\n\na.extend()\n\na.insert()\n\na.remove()\n\na.pop()\n\na.count()\n\na.sort()\n\na.copy()\n\na.index()\n\na.reverse()\n\na.len()\n\nExample:\n# Creating a list\n\nfruits = [\"apple\", \"banana\", \"orange\", \"grape\"]\n\n# Accessing elements\n\nprint(fruits[0]) \n\n# Modifying elements\n\nfruits[1] = \"kiwi\"\n\nprint(fruits) \n\n# Adding elements\n\nfruits.append(\"melon\")\n\nprint(fruits) \n\n# Removing elements\n\n# Removes the first occurrence of the specified element.\n\nfruits.remove(\"orange\")\n\nprint(fruits) \n\n# List length\n\n# finding lenght of the list\n\nprint(len(fruits)) \n\n# Append\n\n#Adds an element to the end of the list.\n\nfruits.append(\"pear\")\n\n# Insert\n\n# Inserts an element at a specific index.\n\nfruits.insert(1, \"pineapple\")\n\n# Pop\n\n# Removes and returns the element at the specified index. If no index is provided, it removes and returns the last element.\n\npopped_fruit = fruits.pop(2)\n\n# Index\n\n# Returns the index of the first occurrence of the specified element.\n\nindex_of_apple = fruits.index(\"apple\")\n\nprint(index_of_apple)\n\n# Count\n\n# Returns the number of occurrences of the specified element.\n\nnum_apples = fruits.count(\"apple\")\n\nprint(num_apples)\n\n# Sort\n\n# Sorts the elements of the list in ascending order.\n\n# sorting the list defult ascending order\n\nfruits.sort()\n\nfruits.sort(reverse=True)\n\n# Reverse\n\n# Reverses the order of the elements in the list.\n\nfruits.reverse()\n\n# Display the final list\n\nprint(\"Final List:\", fruits)
\n\n**Dictionary: -**\n\nA dictionary is an unordered collection of key-value pairs in Python. Each key in a dictionary must be unique, and it is associated with a specific value. Dictionaries are defined by enclosing key-value pairs in curly braces {}.\n\n**Characteristics:**\n- Dictionary is mutable but unordered\n- All the elements are enclosed within flower brackets {}.\n- Each element is separated by comma\n- Each element is nothing but a 'KEY:VALUE' pair.\n- KEY must be a single element and unique\n- VALUE can be of any type like int, str, float, list, tuple.\n\nSyntax Example:\n\nDictionary = {Key1:Value1, Key2:Value2, Key3:Value3}\n\nExample:\n\n# Creating a tuple\n\ncoordinates = (3, 7)\n\n# Accessing elements\n\nx = coordinates[0] \n\ny = coordinates[1] \n\n# Tuple unpacking\n\na, b = coordinates\n\nprint(a, b) \n\n# Length of a tuple\n\nlength = len(coordinates) \n\n# Immutability\n\n# Uncommenting the line below will result in an error since tuples are immutable.\n\n#coordinates[0] = 5\n\n# Creating a new tuple with additional element\n\nnew_coordinates = coordinates + (5,)\n\n# Displaying the final results\n\nprint(\"Original Coordinates:\", coordinates)\n\nprint(\"New Coordinates:\", new_coordinates)
\n\n**Sets:**\nIt is defined by enclosing comma-separated values in curly braces {}.\n\n**Characteristics:**\n- Unordered: Elements in a set do not have a specific sequence.\n- Unique Elements: A set cannot contain duplicate elements.\n- Each element/item must be unique\n- Mutable: Elements can be added or removed after the set is created.\n- Sets remove duplicate values and returns sorted values\n\nMethods:\n\n# Creating a dictionary\n\nstudent_info = {'name': 'John', 'age': 20, 'grade': 'A'}\n\n# Copying the dict\n\nnew_dict = student_info.copy()\n\nprint(new_dict)\n\n# Accessing elements\n\n# Accessing values using keys.\n\nname = student_info['name'] \n\nage = student_info['age'] \n\n# get method\n\nage = new_dict.get('age')\n\nprint(age)\n\n#items method\n\nitems = new_dict.items()\n\nprint(items)\n\n# keys method\n\nkeys = new_dict.keys()\n\nprint(keys)\n\n#values method\n\nvalues = new_dict.values()\n\nprint(values)\n\n# Modifying elements\n\n# Modifying the value associated with a key.\n\nstudent_info['grade'] = 'B'\n\nprint(student_info)\n\nnew_dict.update({'age':24})\n\nprint(new_dict)\n\ncountry = new_dict.setdefault('country','india')\n\nprint(country)\n\nprint(new_dict)\n\n# Adding elements\n\n# Adding new key-value pairs.\n\nstudent_info['gender'] = 'Male'\n\nprint(student_info) \n\n# Removing elements\n\n# Removing key-value pairs.\n\ndel student_info['age']\n\nprint(student_info) \n\npopi = new_dict.pop('grade')\n\nprint(popi)\n\n# Dictionary length\n\n# Determining the number of key-value pairs in a dictionary.\n\nlength = len(student_info)
\n\n#### **Non Primitive Data Type Conversion: -**\n\na = {1, 2, 3, 4, 5}\n\na.add(5)\n\na.remove(3)\n\nlen(a)\n\nset operation (union, intersection, difference)\n\n# Creating a set\n\nunique_numbers = {1, 2, 3, 4, 5}\n\n# Adding elements\n\n# Adding elements to a set.\n\nunique_numbers.add(6)\n\nprint(unique_numbers) \n\n# Removing elements\n\n# Removing elements from a set.\n\nunique_numbers.remove(3)\n\nprint(unique_numbers) \n\n\n# Set length\n\n# Determining the number of elements in a set.\n\nlength = len(unique_numbers) \n\nprint(length)\n\n# Set operations\n\nset1 = {1, 2, 3}\n\nset2 = {3, 4, 5}\n\n# Set operations like union, intersection, and difference.\n\nunion_set = set1.union(set2) \n\nintersection_set = set1.intersection(set2) \n\ndifference_set = set1.difference(set2) \n\n# Displaying the final results\n\nprint(\"Original Set:\", unique_numbers)\n\nprint(\"Union Set:\", union_set)\n\nprint(\"Intersection Set:\", intersection_set)
\n\nprint(\"Difference Set:\", difference_set)
\n\n### **Conclusion:**\n\nIn summary, both primitive and non-primitive data structures are essential in the world of computer science and programming. Primitive structures act as the foundation, serving as the essential building blocks. On the other hand, non-primitive structures provide advanced methods for arranging and handling data, adding complexity and flexibility to the programmer's toolkit.\n","blog_slug":"data-types-in-python-programming","published_date":"Oct 01"},{"title":"Understanding Python Decorators","Descrption":"**Introduction:**\n\nPython decorators are a sophisticated and essential language feature, allowing developers to modify the behavior of functions or methods without altering their actual code. This design pattern is crucial for writing clean, maintainable, and reusable code. In this comprehensive guide, we will explore what decorators are, how they work, and how you can use them effectively in your Python projects.\n\n\n**What are Decorators?**\n\nIn Python, decorators are functions that wrap another function or method, thereby modifying its behavior. They are a form of metaprogramming, where one piece of code manipulates another piece of code at runtime. Decorators provide a way to add functionality to existing functions and methods without changing their actual implementation. This ability to extend and modify code dynamically makes decorators a powerful tool in a Python programmer's toolkit.\n\nDecorators are commonly used for logging, access control, instrumentation, caching, and other cross-cutting concerns. By abstracting these concerns into reusable components, decorators help keep the main logic of the code clean and focused.\n\n\n**The Basic Structure of a Decorator**\n\nDecorators can be classified into different types based on their usage and how they are applied. Here are some common types:\n\n\n\n```\ndef my_decorator(func):\n def wrapper():\n print(\"Something is happening before the function is called.\")\n func()\n print(\"Something is happening after the function is called.\")\n return wrapper\n@my_decorator\ndef say_hello():\n print(\"Hello!\"\n```\n**Why Use Decorators?**\n\nDecorators are useful for a variety of reasons:\n- Code Reusability: By encapsulating reusable behavior in decorators, you avoid code duplication and make your codebase cleaner.\n- Separation of Concerns: Decorators allow you to separate cross-cutting concerns (like logging or access control) from the main logic of your functions.\n- Enhanced Readability: Using decorators can make your code more readable by abstracting away repetitive tasks and focusing on the core functionality.\n\n**Types of Decorators**\n\nDecorators can be classified into different types based on their usage and how they are applied. Here are some common types:\n\n- Function Decorators: These are applied to functions to modify their behavior.\n- Method Decorators: These are similar to function decorators but are specifically applied to methods in classes.\n- Class Decorators: These are used to modify the behavior of classes.\n\n\n**Function Decorators**\n\nFunction decorators extend or modify function behavior by wrapping the original function in a new one that adds additional functionality before, after, or around the original execution. This approach promotes code reusability and clean separation of concerns, making the main function logic more focused and maintainable.\n\n\n**Method Decorators**\n\nMethod decorators modify instance methods, allowing them to interact with the instance attributes and methods via self. They are useful for adding behaviors like logging, access control, or performance monitoring, leveraging the class context for more powerful modifications.\n\n\n**Class Decorators**\n\nClass decorators modify or extend entire classes by taking a class as an argument and returning a modified class. They can add methods, alter existing ones, or introduce new attributes, making them useful for applying consistent behavior across multiple classes.\n\n**Decorators with Arguments**\n\nDecorators with arguments involve an additional layer where the outer function accepts parameters and returns the actual decorator. This design allows decorators to be configurable and adaptable, enabling flexible applications in various contexts.\n\n\n**Preserving Function Metadata with functions.wraps**\n\nUsing functions.wraps ensures that the wrapper function retains the original function's metadata, such as its name and docstring. This practice is crucial for maintaining clear documentation, debugging, and introspection.\n\n\n**Applying Multiple Decorators**\n\nChaining multiple decorators allows the combining of various behaviors on a single function or method. Decorators are applied in a specified order, from the innermost to the outermost, enabling complex functionality through modular, reusable components while maintaining clear and maintainable code.\n\n**Practical Use Cases for Decorators**\n\nDecorators are commonly used in various real-world scenarios. Some typical use cases include:\n- Logging: Adding logging functionality to functions to track their execution.\n- Access Control: Implementing permission checks before allowing access to certain functions or methods.\n- Memorization: Caching the results of expensive function calls to improve performance.\n- Validation: Validating input arguments before executing a function.\n- Instrumentation: Measuring the execution time of functions for performance monitoring.\n\nThese examples illustrate how decorators can be used to add functionality to existing code in a clean and reusable way. Whether you need to log function calls, enforce access control, cache expensive computations, validate inputs, or measure performance, decorators provide a flexible and elegant solution.\n\n**Conclusion**\n\nDecorators are a versatile and powerful feature in Python, allowing developers to write cleaner, more modular code. They enable the addition of functionality to functions and methods without altering their implementation. By understanding and utilizing decorators, you can significantly enhance your Python programming skills and create more maintainable code.\n\n\n\n\n\n\n","blog_slug":"understanding-python-decorators","published_date":"June 21"},{"title":" Understanding Regularization: How to Prevent Overfitting in Machine Learning Models","Descrption":"In the realm of machine learning, the ability to generalize well to unseen data is paramount. One of the most common challenges faced in this context is overfitting, where a model performs exceptionally well on training data but fails to replicate that performance on new, unseen data. Overfitting occurs when a model learns not just the underlying patterns in the data, but also the noise and outliers. Regularization is a crucial technique to address this problem, ensuring that models maintain their ability to generalize without being overly complex.\n# List to Tuple (and Vice Versa):
\n\nmy_list =[1, 2, 3, 4, 5]
\n\nmy_tuple = tuple(my_list)
\n\nprint(my_tuple)\n\n# From Tuple to List:\n\nmy_tuple = (1, 2, 3, 4, 5)
\n\nmy_list = list(my_tuple)
\n\nprint(my_list)\n\n# List of Tuples to Dictionary:\n\nmy_list_of_tuples = [(\"apple\", 5), (\"banana\", 2), (\"orange\", 3)]
\n\nmy_dict = dict(my_list_of_tuples)
\n\nprint(my_dict)\n\n# Tuple to Dictionary:\n\nmy_tuple = ((\"apple\", 5), (\"banana\", 2), (\"orange\", 3))\n\nmy_dict = dict(my_tuple)\n\nprint(my_dict)\n\n# Dictionary to List of Tuples\n\nmy_dict = {\"apple\": 5, \"banana\": 2, \"orange\": 3}\n\nmy_list_of_tuples = list(my_dict.items())\n\nprint(my_list_of_tuples)\n\n# Set to List (and Vice Versa)\n\n# From Set to List:\n\nmy_set = {1, 2, 3, 4, 5}\n\nmy_list = list(my_set)\n\nprint(my_list)\n\n# From List to Set:\n\nmy_list = [1, 2, 2, 3, 4, 4, 5]\n\nmy_set = set(my_list)\n\nprint(my_set)\n\n# Set to Tuple (and Vice Versa)\n\n# From Set to Tuple:\n\nmy_set = {1, 2, 3, 4, 5}\n\nmy_list = tuple(my_set)\n\nprint(my_list)\n\n# From tuple to Set\n\nmy_list = (1, 2, 2, 3, 4, 4, 5)\n\nmy_set = set(my_list)\n\nprint(my_set)
\n\n## **The Problem of Overfitting**\n\no grasp the importance of regularization, it's essential to understand overfitting in detail. Overfitting occurs when a machine learning model is excessively complex, capturing not only the true patterns in the data but also the noise. This happens when the model has too many parameters relative to the number of observations, leading to a model that is highly sensitive to fluctuations in the training data. For example, consider a polynomial regression model that fits a high-degree polynomial to a dataset with a limited number of data points. While the model might achieve perfect accuracy on the training data, it is likely to perform poorly on new data because it has learned the peculiarities of the training set rather than the underlying relationship.\n
\n\n### **What is Regularization?**\n\nRegularization is a technique used to prevent overfitting by adding a penalty to the loss function during the training process. This penalty discourages the model from becoming too complex, effectively controlling the magnitude of the model's parameters. By doing so, regularization helps in reducing variance at the cost of a slight increase in bias, leading to a more robust model that generalizes better to new data.\n
\n\n### **Types of Regularization Techniques**\n\nThere are several regularization techniques commonly used in machine learning, each with its own approach to mitigating overfitting. The most popular ones include L1 Regularization (Lasso), L2 Regularization (Ridge), and Elastic Net, which combines both L1 and L2 regularization.\n\n#### **1. L1 Regularization (Lasso):**\nL1 regularization adds a penalty equal to the absolute value of the magnitude of coefficients. This leads to sparse models, where some feature weights are reduced to zero, effectively performing feature selection.\n\n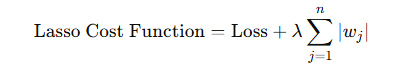\n\nHere, λ is the regularization parameter, which controls the strength of the penalty.\n\n#### **2. L2 Regularization (Ridge):**\n\nL2 regularization, on the other hand, adds a penalty equal to the square of the magnitude of coefficients. This approach tends to shrink the coefficients, but it does not necessarily set them to zero.\n\n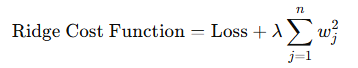\n\nL2 regularization tends to work well when all input features contribute to the output and need to be shrunk uniformly.\n\n#### **3. Elastic Net:**\nElastic Net is a hybrid approach that combines both L1 and L2 regularization. It is particularly useful when there are multiple correlated features, as it tends to outperform either L1 or L2 regularization alone.\n\n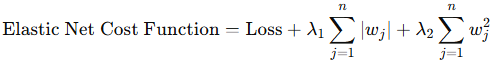\n\nThe parameters λ1 and λ2 control the contribution of L1 and L2 penalties, respectively.\n
\n\n### **How Regularization Works**\n\nThe central idea behind regularization is to add a penalty term to the model's cost function. This penalty discourages the model from fitting the noise in the training data by reducing the magnitude of the coefficients. As a result, the model becomes simpler, with less capacity to overfit.\n\nBy controlling the complexity of the model, regularization ensures that the model is not too flexible, which helps in improving its performance on unseen data. The regularization parameter λ plays a critical role here. If λ is set too high, the model may underfit, as it will become too simple. On the other hand, if λ is too low, the regularization effect may be minimal, leading to overfitting.\n
\n\n### **When to Use Regularization**\n\nRegularization should be considered whenever there is a risk of overfitting, especially in situations where the model has a large number of parameters or when the training data is limited. Models with high variance, such as decision trees or deep neural networks, often benefit from regularization to improve their generalization capabilities.\n
\n\n### **Balancing Bias and Variance**\n\nRegularization introduces a bias-variance tradeoff in machine learning models. By penalizing large coefficients, regularization increases bias but reduces variance, leading to a more balanced model. The goal is to find the optimal balance where the model is complex enough to capture the underlying patterns in the data but not so complex that it overfits the training data. Cross-validation is a commonly used technique to find this balance by selecting the appropriate value of the regularization parameter.\n
\n\n## **Conclusion**\nRegularization is a powerful tool in the arsenal of machine learning practitioners, offering a robust solution to the problem of overfitting. By introducing penalties for large coefficients, regularization techniques like Ridge, Lasso, and Elastic Net simplify models, improve generalization, and enhance interpretability. Understanding when and how to apply regularization is crucial for building models that perform well on real-world data, striking the right balance between bias and variance. As machine learning continues to evolve, regularization will remain a fundamental concept in the development of reliable, high-performing models.\n\n\n\n\n\n","blog_slug":"Understanding-Regularization","published_date":"03 May 2025"},{"title":"Introduction to Tkinter Widgets and Layouts","Descrption":"Tkinter is a powerful and user-friendly library in Python that is widely used for building graphical user interface (GUI) applications. It comes bundled with Python, making it a convenient choice for both beginners and experienced developers who want to create desktop applications. Tkinter provides a rich collection of widgets—predefined GUI elements—that you can use to design and build interactive and visually engaging applications.\n\nIn this comprehensive guide, we will delve into some of the most commonly used Tkinter widgets: Buttons, Labels, and Entry Fields. These widgets are the building blocks of almost every GUI application. We will explain their core functionality, discuss the customization options available, and demonstrate their usage through practical examples. Whether you're designing a simple form or a full-featured application, understanding these widgets is essential for effective GUI development in Python.\n\n### **Understanding Tkinter Layout Management**\nCreating a visually appealing and user-friendly GUI involves more than just placing widgets on the screen. Proper **layout management** ensures that widgets are arranged in a way that is logical, responsive, and easy to interact with. Tkinter provides three primary layout management techniques: **Pack, Grid, and Place**. Each of these layout managers offers unique capabilities and is suited for different types of layouts and design requirements.
\n- **Pack** is simple and ideal for basic layouts where widgets are stacked vertically or horizontally.\n- **Grid** offers more control, allowing you to place widgets in a tabular format defined by rows and columns.\n- **Place** provides absolute positioning, giving you complete control over where each widget appears on the screen.\n\n### **Enhancing GUI Structure with Frames and Menus**\nWhen building complex GUI applications, it's important to maintain a clear structure and intuitive navigation. Two essential tools in Tkinter for achieving this are Frames and Menus.\n- **Frames** act as containers that group related widgets together. This not only helps in organizing the layout but also makes your code more modular and easier to maintain. You can use frames to separate different sections of your application, such as headers, sidebars, or content areas.\n- **Menus**, on the other hand, enable you to incorporate dropdown menus, toolbars, and other navigational elements into your application. With menus, you can provide users with access to features like file operations, settings, help sections, and more. Menus can be nested and customized to suit the specific needs of your application.\n\n \n
\n
\n\n \n
\n \n
\n
\nEntry fields, also known as **text input fields**, are used to capture input from users in a Tkinter application. Tkinter provides the **Entry widget** to facilitate single-line text entry, making it ideal for forms, login screens, search boxes, and other interactive components that require user input.\n\n**Basic Syntax for Creating a Entry Fields**
\n**Layout Management in Tkinter:** Pack, Grid, and Place
\nIn Tkinter, once you've created widgets like buttons, labels, or entry fields, you need to position them within your application window. This is where layout management comes into play. Tkinter provides three geometry managers to control the layout and arrangement of widgets:\n\n- **pack()**– Simplest layout method; stacks widgets vertically or horizontally.\n- **grid()** – Aligns widgets in a grid of rows and columns, great for forms and tables.\n- **place()** – Allows absolute positioning using x and y coordinates\n\n \n
\n
\nThe Pack layout manager is one of the simplest and most widely used layout systems in Tkinter. It arranges widgets by **stacking them** either **vertically** (top to bottom) or **horizontally** (left to right) within their parent container. This manager is ideal for basic layouts where widgets are placed in a linear, flowing manner without the need for complex alignment or grid-based positioning.
\n**Example:** Using pack() Layout Manager in Tkinter\n\n \n
\n
\nThe **Grid** layout manager offers a **table-like (row-column)** structure for organizing widgets. It allows you to place widgets precisely in a specific cell of an invisible grid, providing much **greater control over layout** and alignment than the Pack manager. Each widget is assigned a **row and column**, and you can control spacing, alignment, and spanning across multiple rows or columns.
\n**Example:** Using grid() Layout Manager in Tkinter\n\n \n
\n
\n**Example:** Using place() Layout Manager in Tkinter\n\n \n
\n
\nIn Tkinter, **Frames** and **Menus** play crucial roles in building structured, organized, and interactive GUI applications.\n- **Frames** act like containers to group and organize widgets logically and visually.\n- **Menus** provide a way to integrate dropdown navigation and commands, enhancing the usability of your application.\n\n \n
\n
\n**Frames** in Tkinter serve as **container widgets** that are used to **group and organize other widgets** within an application. Think of a frame as a subsection or a mini-window inside your main window. Frames make it easier to build **modular, structured, and manageable GUIs**, especially as your application becomes more complex.
\n**Example:** Using Frames in Tkinter\n\n \n
\n
\n\n1. **Menu:** The main menu bar, typically placed at the top of the window, containing dropdown options.\n2. **Menu Button:** A button that displays a dropdown menu when clicked, often used for context-sensitive or tool-specific actions.\n**Example:** Working with Menus in Tkinter\n\n \n
\n
\n**Syntax:**
\n*age = 18
*\n*status = \"Adult\" if age >= 18 else \"Minor\"
*\n*print(status)*\n\nThe status is set to \"Adult\" in the code above if the age is 18 or older, and to \"Minor\" otherwise. When you require a straightforward conditional assignment, this one-line form is ideal.\n\n#### **When Not to Use:**\nThe ternary operator works well in straightforward situations, but it should be avoided in more complicated ones as it may make the code more difficult to understand.
\n**For instance:**
\n*x = float(input(“Enter a number : “)
*\n*result = \"High\" if x > 10 else \"Medium\" if x > 5 else \"Low\"
*\nIn this case, a regular if-elif-else structure would be more readable.\n\n### **Pattern Matching: A New Way to Control Flow**\nIntroduced in Python 3.10, was inspired by comparable structures in functional programming languages such as Scala. It enables you to combine intricate data structures and break them down into a single, tasteful statement.\n\nWhen working with nested data structures, like lists, tuples, or even bespoke objects, pattern matching is especially helpful. t allows you to match intricate data structures against patterns, providing a structured and declarative approach to decision-making.\n\n**Basic Syntax:**
\n*match subject:
*\n *case pattern1:
*\n *# do something
*\n case pattern2:
\n *# do something else
*\n\n**Example:**
\nTo determine whether a word is a palindrome.
\n*match word:
*\n *case word if word == word[::-1]:
*\n *print(\"Palindrome\")
*\n *case _:
*\n *print(\"Not a palindrome\")
*\nThe first case in this example determines whether the word is the same when it is inverted (word == word[::-1]). It outputs \"Palindrome\" if it matches and \"Not a palindrome\" otherwise.\n\n### **Pattern matching along with an if statement**\nFinding Positive, Negative, or Zero Using Pattern Matching with if
\n*number = 0
*\n*match number:
*\n *case number if number > 0:
*\n *print (\"Positive\")
*\n *case number if number < 0:
*\n *print (\"Negative\")
*\n *case 0:
*\n *print (\"Zero\")
*\n\n### **Advantages of Pattern Matching:**\n- **Clarity:** Pattern matching offers a methodical and transparent approach to managing intricate decision-making. \n- **Flexibility:** It functions well with a range of data structures, such as lists, custom objects, and tuples. \n- **Decomposition:** It eliminates the need for extra code by enabling you to extract portions of the data while matching.\n\n### **Limitations:**\nPattern matching is still in its infancy and might not be extensively utilized in more established Python projects. Additionally, it might not be required for easier jobs; conventional if-else structures might work just well.\n\n### **Conclusion**\nBy mastering ternary operators and pattern matching, you can elevate your Python programming skills. While the ternary operator is suitable for simple conditional assignments, pattern matching offers a robust tool for handling complex data structures and intricate decision-making. By understanding their strengths and limitations, you can write more efficient, readable, and maintainable Python code.\n\n\n","blog_slug":"advanced-conditional-logic","published_date":"21 May 2025"},{"title":"GIT INTRODUCTION","Descrption":"Version control software allows you to take snapshots of a project whenever it's in a working state when you make changes to a project.
\n\nUsing version control software gives you the freedom to work on improvements & make mistakes without worrying about ruining your project.
\n\nGit is the most popular version control software in use now a day's git implement version control by tracking the changes made to every file in a project; if you make a mistake you can just return to a previously saved state. Git runs on all the Operating System, but there are different approaches to installing it on each system.
\n\nTo download a git installer from git - downloads. After installing, open a new terminal window & issue the command \"git --version.\" you will see the output listing a specific version number.
\n\n**Configuring Git:**
\n\nGit keep's track of who makes changes to a project to do this git needs to know your username & email
\n$ git config --global user.name \"username\"
\n$ git config --global user.email \"username@gmail.com\"
\n\n\n**Making a project:**\n\nCreate a folder on your system called “git_practice” Inside the folder, make a python program (file)
\nHello-git.py
\n\nTo tell git to ignore this directory, make special file called “.gitignore\" with no file extension and add the following line to it: “_pychache_\"
\n\n**Initialising a repository: -**
\n\n→a directory containing a python file & .gitignore file, you can initialise a git repository. Open terminal and navigate (cd) to the folder. & run the following: \"git init\"
\n\n→ all the files git uses to manage the repository are located in the hidden directory \".git,\" which you won't need to work with at all.
\n\n**Checking the status:**\n\n→ let's look at the project's status using \"git status\"
\n\n**Adding file to the repository:**
\n\nAdding the files to the repository using \"git add\"
\n\n**Making a commit:**
\n\nMake the first commit using \"git commit -m \". \"first commit\" (• the -a flag tells git to add all modified file in the repository to current commit\n\n**Checking the log:**
\n\nGit keeps a log of all commits made to the project. Using \"git log\"
\nDeleting to repository:
\nUse the command \"rm -rf .git/\" to delete the .git directory.
\n\nCode snippet to start the git project:
\n1. Configuring Git (Set your global username and email)
\n$ git config --global user.name \"your_username\"
\n$ git config --global user.email \"your_email@gmail.com\"
\n\n \n2. Create the project folder and the Python file
\n$ mkdir git_practice
\n$ cd git_practice
\n$ touch Hello-git.py # Create the Python file
\n\n\n3. Create .gitignore to ignore pycache
\n$ touch .gitignore
\n$ echo \"__pycache__\" >> .gitignore # Add __pycache__ to .gitignore
\n\n\n4. Initialize the Git repository
\n$ git init\n\n\n5. Check the status of the repository\n$ git status\n\n6. Add files to the repository\n$ git add .\n\n7. Make your first commit\n$ git commit -m \"first commit\"\n\n 8. Check the commit log\n$ git log\n\n9. If you want to delete the repository (remove .git directory)\n$ rm -rf .git/\n\n\n**Conclusion:**
\nVersion Control gives you the freedom to work on improvements and mistakes without worrying about your project. We’re then free to use git init to start a fresh repository. Checking the status shows that we’re back at the initial stage, awaiting the first commit. We add the files and make the first commit. Checking the status now shows us that we’re on the main branch with nothing to commit.\nUsing version control takes a bit of practice, but once you start using it, you’ll never want to work without it again\n\n\n\n","blog_slug":"git-introduction","published_date":"7 th June 2025"}]},{"name_and_surname":"Jayaraj U","short_description":"Jayaraj U is studying Computer Science in Diploma at SJP Govt Polytechnic","twitter_url":null,"linkedin_url":"https://www.linkedin.com/in/jayaraj-u-bb0719276/","designation":"ML & AI Intern At Analogica","image":{"localFile":{"childImageSharp":{"gatsbyImageData":{"layout":"constrained","backgroundColor":"#d8e8f8","images":{"fallback":{"src":"/static/4a4ed167e8ba4a615de6b975be6ff387/84e34/Jayaraj_U_f3387cc73f.jpg","srcSet":"/static/4a4ed167e8ba4a615de6b975be6ff387/2a2aa/Jayaraj_U_f3387cc73f.jpg 220w,\n/static/4a4ed167e8ba4a615de6b975be6ff387/d50c1/Jayaraj_U_f3387cc73f.jpg 440w,\n/static/4a4ed167e8ba4a615de6b975be6ff387/84e34/Jayaraj_U_f3387cc73f.jpg 879w","sizes":"(min-width: 879px) 879px, 100vw"},"sources":[{"srcSet":"/static/4a4ed167e8ba4a615de6b975be6ff387/e4ac7/Jayaraj_U_f3387cc73f.webp 220w,\n/static/4a4ed167e8ba4a615de6b975be6ff387/3c084/Jayaraj_U_f3387cc73f.webp 440w,\n/static/4a4ed167e8ba4a615de6b975be6ff387/28408/Jayaraj_U_f3387cc73f.webp 879w","type":"image/webp","sizes":"(min-width: 879px) 879px, 100vw"}]},"width":879,"height":690}}}},"blogs":[{"title":"Seaborn","Descrption":"## Introduction to Seaborn Library in Python\n\nSeaborn is a powerful Python data visualization library built on top of Matplotlib. It provides a high-level interface for creating attractive and informative statistical graphics. Seaborn simplifies the process of creating visually appealing visualizations, making it a popular choice among data scientists and analysts.\n\n#### What is Seaborn?\nSeaborn is an open-source Python library that is specifically designed for data visualization. It offers a wide range of statistical plots, color palettes, and themes to create aesthetically pleasing and informative visualizations. Seaborn builds upon Matplotlib and provides a higher-level API, making it easier to use and customize plots.\n\n#### Key Features of Seaborn:\n\n**Seaborn comes with several features that make it a valuable tool for data visualization:**\n- **High-level plotting functions:** Seaborn provides a set of high-level functions that simplify the creation of complex visualizations with concise code.\n- **Statistical data visualization:** Seaborn integrates statistical techniques with visualization, enabling users to explore relationships and patterns in their data.\n- **Attractive default styles:** Seaborn includes visually appealing default styles and color palettes that enhance the aesthetics of plots.\n- **Integration with Pandas:** Seaborn seamlessly integrates with Pandas, making it easy to work with data frames and perform visualizations on structured data.\n- **Wide range of plot types:** Seaborn offers a variety of plot types, including scatter plots, line plots, bar plots, histograms, box plots, violin plots, and more.\n- **Customizability:** Seaborn provides flexible options for customizing plots, such as adjusting colors, styles, and themes to match specific requirements.\n\n#### Installation of Seaborn\nTo use Seaborn, you need to have Python and the Seaborn library installed. You can install Seaborn using pip, a package manager for Python. Simply run the following command in your terminal:\n> pip install seaborn\n\n#### Importing Seaborn\nOnce installed, you can import Seaborn into your Python script or Jupyter Notebook using the following import statement:\n> import seaborn as sns\n\n#### Visualizing the data using Seaborn\n\nSeaborn provides various types of plots that can be used for different kinds of data and requirements. Some of the commonly used plots are\n\n1. Line plot\n2. Scatter plot\n3. Bar plot\n4. Histogram\n5. Violin Plot\n6. Pair Plot\n\n#### Line Plot\n\nA line plot represents the trend or progression of a variable over time or any continuous variable. Seaborn's lineplot() function can be used to create line plots. Line plots are effective for visualizing trends, comparing multiple lines, and showing changes over a continuous interval.\n\n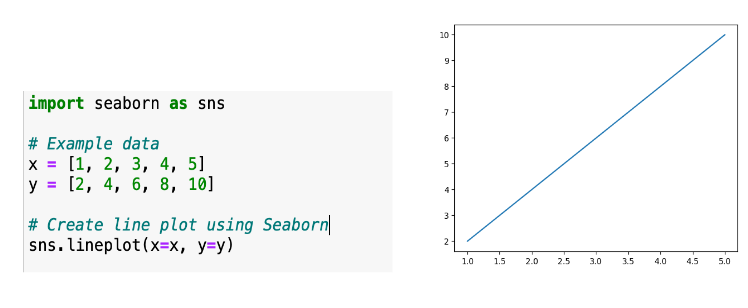\n\n\n#### Scatter Plot\n\nA scatter plot displays the relationship between two numerical variables. It can be created using the scatterplot() function in Seaborn. Scatter plots are useful for identifying patterns, trends, and correlations between variables.\n\n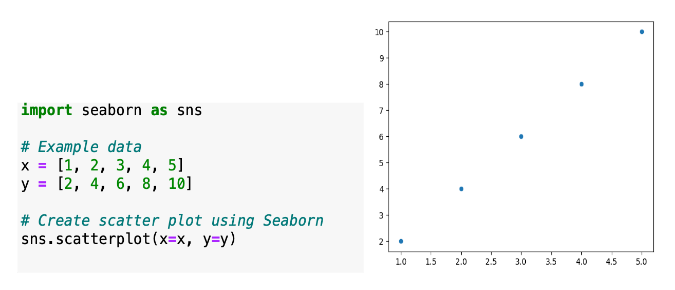\n\n#### Bar Plot\n\nBar plots are used to compare categorical variables or display the distribution of a single categorical variable. Seaborn's barplot() function can be used to create bar plots. They are suitable for showing comparisons, highlighting differences, and visualizing categorical data.\n\n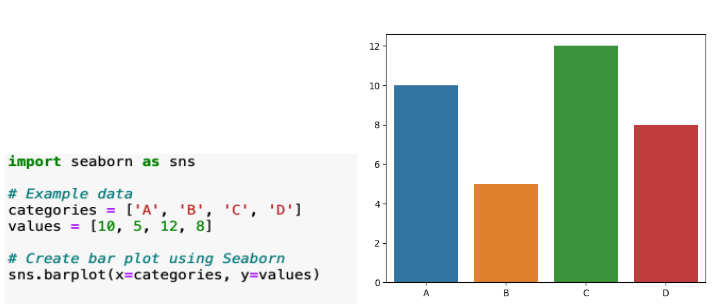\n\n#### Histogram\n\nHistograms show the distribution of a single numerical variable by dividing it into bins and displaying the count or frequency of values in each bin. Seaborn's histplot() function can be used to create histograms. Histograms are useful for understanding the shape, spread, and central tendency of a variable.\n\n\n\n#### Violin Plot\n\nA violin plot is similar to a box plot but also includes a rotated kernel density plot on each side, which provides a more detailed view of the data distribution. Seaborn's violinplot() function can be used to create violin plots. Violin plots are effective for comparing distributions and understanding the density of the data.\n\n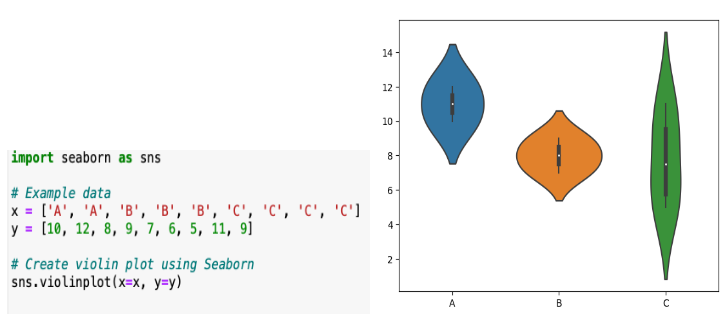\n\n#### Pair Plot\n\nA pair plot, also known as a scatterplot matrix, displays pairwise relationships between multiple variables in a dataset. Seaborn's pairplot() function can be used to create pair plots. Pair plots are useful for identifying correlations, patterns, and outliers in multivariate data.\n\n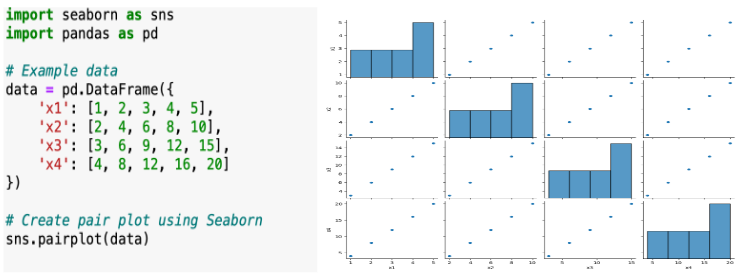\n\n## **Matplotlib VS Seaborn**\n\nThe choice between Seaborn and Matplotlib depends on your specific requirements and preferences. There is no definitive answer to which one is better, as both libraries have their strengths and weaknesses. Here are some factors to consider when deciding which library to use:\n\n- **Ease of Use:** Seaborn generally has a more user-friendly and intuitive API compared to Matplotlib. It provides high-level functions that make it easier to create complex statistical plots with fewer lines of code. If you prefer simplicity and ease of use, Seaborn might be a better choice.\n- **Plot Customization:** Matplotlib offers extensive customization options, allowing you to have precise control over individual plot elements. If you require fine-grained control and want to create highly customized plots, Matplotlib might be a better fit for your needs.\n- **Default Aesthetics:** Seaborn focuses on providing visually appealing default styles and themes. It applies consistent colors, styles, and plot layouts, resulting in attractive plots without much customization. Matplotlib, on the other hand, requires more manual effort to achieve aesthetically pleasing plots. If you prioritize aesthetics and want visually pleasing plots without much customization, Seaborn may be preferable.\n- **Statistical Visualizations:** Seaborn specializes in statistical visualizations and provides high-level functions for creating various statistical plots. It offers convenient APIs for plots like box plots, violin plots, bar plots with error bars, etc. If your data analysis heavily relies on statistical visualizations, Seaborn can be a valuable tool. Matplotlib also supports statistical visualizations, but it may require more manual effort to create specialized plots.\n- **Integration:** Seaborn is built on top of Matplotlib, which means you can still access the underlying Matplotlib functions if needed. This makes it easy to combine the strengths of both libraries and leverage Matplotlib's versatility when required.\n\n#### Conclusion\n\nIn this blog, we delved into the introduction of the Seaborn library, a powerful tool for data visualization in Python. We explored various aspects of Seaborn, from installation to creating different types of plots. While both Matplotlib and Seaborn are widely used visualization libraries, Seaborn offers a higher-level interface and a more aesthetically pleasing style, we highlighted the simplicity and elegance of Seaborn's syntax, making it an excellent choice for both beginners and experienced data practitioners. Seaborn's extensive documentation and integration with other Python libraries, such as NumPy and Pandas, further enhance its capabilities and flexibility.\n\nthe choice between Matplotlib and Seaborn comes down to personal preference and the specific requirements of your visualization task. However, Seaborn's rich functionality, ease of use, and visually appealing plots make it a compelling option for data visualization in Python.\n\n\n\n\n\n\n\n\n\n\n\n\n\n\n\n\n\n\n\n\n\n\n\n","blog_slug":"Seaborn","published_date":"15 June 2023"},{"title":"Seaborn vs. Matplotlib: A Visual Journey","Descrption":"### A Visual Journey\n\nData visualisation is a crucial component of data science and analytics because it makes it easier to find patterns and insights in large, complex datasets. Python provides a number of visualization-related libraries, including Matplotlib and Seaborn. Both libraries are used for data visualisation, although they each have unique features and applications. We will examine the fundamental distinctions between Matplotlib and Seaborn in this article, highlighting their benefits and the situations in which each library shines.\n\n#### **MATPLOTLIB**\n\n\n\n\nA low-level interface for producing static, animated, and interactive visualisations is provided by Matplotlib, one of the most well-known and commonly used data visualisation tools in Python. Numerous customization options are available, giving users complete control over every element of their plots. Line plots, scatter plots, bar plots, histograms, and other forms of graphs are supported by Matplotlib. When you need exact control over the aesthetics and arrangement of the plot, it is a great option.\n\n\n\n#### **SEABORN**\n\n\n\n\nA higher-level data visualisation library built on top of Matplotlib is called Seaborn. For producing aesthetically appealing statistical visualisations, it provides a more streamlined and user-friendly API. With an emphasis on producing meaningful charts with little code, Seaborn streamlines basic visualisation tasks. It has built-in colour schemes and themes that improve the plots' visual appeal. With Seaborn, you can easily create complex visualisations and analyse statistical exploratory data.\n\n\n#### **Key difference**\n\n- **Abstraction Level:** Matplotlib offers a lower level of abstraction, giving users total power over customising their plots. On the other side, Seaborn removes a lot of technical complexities and offers a higher level of abstraction, making it easier to easily create visually pleasing plots.\n- **Plot Aesthetics:** In Matplotlib, producing aesthetically appealing plots frequently necessitates more manual customisation. With its pre-installed themes and colour schemes, Seaborn provides plots with a visually appealing appearance right out of the gate.\n- **Statistical charting:** Seaborn specialises in statistical charting and provides a variety of statistical visualisation methods, such as regression plots, distribution plots, box plots, and violin plots. Although these plots may also be produced using Matplotlib, Seaborn makes the process easier and improves the visual appearance.\n- **Usability:** Compared to Matplotlib, Seaborn offers a simpler and more clear API. Common data visualisation chores are made simpler, and less code is needed to produce intricate plots.\n\n\n#### **When to Use Each Library**\n\n- **Matplotlib:** When you need complete control over plot customisation and the requirement to produce highly customised or specialised visualisations, go with Matplotlib. It is appropriate for developing plots and situations of publication-quality where exact control is required.\n - **Seaborn:** Choose Seaborn if you wish to rapidly and easily build appealing statistical visualisations. It is a great option for illuminating relationships between variables, performing exploratory data analysis, and creating instructive graphs without delving too deeply into the nitty-gritty.\n\n\n#### **Conclusion**\nPowerful Python libraries for data visualisation, Matplotlib and Seaborn each have their own advantages and applications. For developing highly customised or specialised visualisations, Matplotlib offers total flexibility over plot customisation. By providing a more user-friendly API, Seaborn makes it easier to produce aesthetically appealing data visualisations. Understanding how these libraries differ will help you select the one that best meets your visualisation requirements and strengthens your data analysis skills.\n","blog_slug":"seaborn-vs-matplotlib-a-visual-journey","published_date":"20 June 2023"}]},{"name_and_surname":"Rohit K","short_description":"Rohit K is studying Computer Science in Diploma at SJP Govt Polytechnic","twitter_url":null,"linkedin_url":"https://www.linkedin.com/in/rohit-k-880653255/","designation":"ML & AI Intern At Analogica","image":{"localFile":{"childImageSharp":{"gatsbyImageData":{"layout":"constrained","backgroundColor":"#e84888","images":{"fallback":{"src":"/static/992b01ff726640b712b328987127c437/3c88a/Rohit_k_cce29995a0.jpg","srcSet":"/static/992b01ff726640b712b328987127c437/f27c4/Rohit_k_cce29995a0.jpg 164w,\n/static/992b01ff726640b712b328987127c437/1a4d1/Rohit_k_cce29995a0.jpg 328w,\n/static/992b01ff726640b712b328987127c437/3c88a/Rohit_k_cce29995a0.jpg 655w","sizes":"(min-width: 655px) 655px, 100vw"},"sources":[{"srcSet":"/static/992b01ff726640b712b328987127c437/43e67/Rohit_k_cce29995a0.webp 164w,\n/static/992b01ff726640b712b328987127c437/cf59a/Rohit_k_cce29995a0.webp 328w,\n/static/992b01ff726640b712b328987127c437/13a92/Rohit_k_cce29995a0.webp 655w","type":"image/webp","sizes":"(min-width: 655px) 655px, 100vw"}]},"width":655,"height":645}}}},"blogs":[{"title":"Unveiling the Magic of Matplotlib: Exploring Python's Data Visualization Library","Descrption":" ### Introduction to Matplotlib Library in Python\n\nWe will be using the Matplotlib library for Data Visualisation of complex patterns of the dataset. So, it helps to understand the patterns, and tendencies in the data to the data analysts or data scientists so that they can come to some conclusion.\n\nIn this blog, we will see what Matplotlib is. How to install matplotlib? various types of plots using Matplotlib. So let’s start it.\n\n\n### What is Matplotlib?\n\nMatplotlib is an open-source library that is used for visualising any data using various kinds of plots. It was written by John D. Hunter in 2003. According to the recent release, the latest version is Matplotlib 3.7.0(Feb 13, 2023). \n\nMatplotlib is a popular data visualisation library in Python that provides an easy-to-use interface for creating high-quality plots and visualizations. It is widely used in data science and scientific research to visualize data, explore patterns, and communicate insights.\n\n### Installation of Matplotlib\n\n- Install Matplotlib using CMD:\nIf Matplotlib is not installed on your machine, you can install it using pip. Open up your command prompt or terminal and type the following command:\n> pip install matplotlib\n- Install Matplotlib using Anaconda prompt:\nYou can install matplotlib using the ‘conda’ command in the Anaconda prompt as shown below:\n> conda install matplotlib\n\nSo we have installed the matplotlib library in our system, and we will dive into different topics.\n\n### Visualizing the data using matplotlib\n\nMatplotlib provides various types of plots that can be used for different kinds of data and requirements. Some of the commonly used plots are\n- Line plot\n- Scatter plot\n- Bar plot\n- Histogram\n- Boxplot\n- Pie charts\n\n#### **Line Plot**\nA line plot, also known as a line chart or line graph, is a chart commonly used to visualize the relationship between two variables. It consists of a series of data points connected by straight lines. The plot() function in Matplotlib is used to plot the x and y coordinates.\n\nThe syntax follows as below:\n> matplotlib.pyplot.plot(*args, scalex=True, scaley=True, data = None, **kwargs)\n\n**Parameters:**\n1. x,y: These parameters are the horizontal and vertical coordinates of the data points.\n2. data: This parameter is optional and it is an object with labeled data.\n3. scalex, scaley: These parameters determine if the view limits are adapted to the data limits.\n\n\n\n\n\n#### **Scatter Plot**\n\nA scatter plot is a type of chart that is used to visualize the relationship between two variables. It consists of a series of points on a two-dimensional plane, where each point represents the value of both variables.\n\nIn a scatter plot, one variable is plotted on the horizontal x-axis, while the other variable is plotted on the vertical y-axis. Each data point is then represented by a point on the chart. The position of the point on the chart indicates the value of the two variables for that data point.\n\nScatter plots are useful for identifying patterns and relationships between variables. They can be used to determine if there is a correlation between the variables and if so, whether the correlation is positive or negative.\n\nScatter plots can also be used to display multiple groups or categories of data, where each group is represented by a different color or symbol on the chart. This allows for easy comparison between groups and can help identify differences or similarities in the data. The syntax follows as below:\n> matplotlib.pyplot.scatter(x_axis_data, y_axis_data, s, c, marker, camp, vmap, vmin, vmax, alpha, linewidths, edgecolors)\n\n**Parameters:**\n- x,y: These parameters are the horizontal and vertical coordinates of the data points.\n- s: This parameter indicates the marker size. It is an optional parameter and the default value is None.\n- c: This parameter indicates the color of the sequence and it is an optional parameter with a default value equal to None.\n- alpha: This option indicates the blending value, between 0 (transparent) and 1 (opaque).\n\n\n\n\n\n\n#### **Bar Plot**\n\nA bar plot, also known as a bar chart, is a type of chart that is used to compare categorical data. It consists of a series of bars, where the height of each bar represents the value of a particular category or group.\n\nIn a bar plot, the categories are plotted on the horizontal x-axis, while the values are plotted on the vertical y-axis. Each category is represented by a separate bar, and the height of the bar represents the value for that category.\n\nBar plots are useful for comparing the values of different categories or groups. They can be used to show which categories have the highest or lowest values and to identify any trends or patterns in the data.\n\nBar plots can also be used to display multiple sets of data side-by-side, where each set of data is represented by a separate group of bars. This allows for easy comparison between different sets of data and can help identify differences or similarities in the data. The syntax follows as below:\n> matplotlib.pyplot.bar(x, height, width, bottom, align)\n\n**Parameters:**\n- x: sequence of scalars representing the x coordinates of the bars. align controls if x is the bar center (default) or left edge.\n- height: scalar or sequence of scalars representing the height(s) of the bars.\n- width: scalar or array-like, optional. the width(s) of the bars default 0.8\n- bottom: scalar or array-like, optional. the y coordinate(s) of the bars default None.\n- align: {‘center’, ‘edge’}, optional, default ‘center’\n\n\n\n\n\n#### **Histogram**\n\nA histogram is a type of chart that is used to visualize the distribution of a dataset. It consists of a series of vertical bars, where the height of each bar represents the frequency or count of data points within a particular range or bin.\n\nIn a histogram, the x-axis represents the range of values in the dataset, while the y-axis represents the frequency or count of data points within each range or bin. The bars are typically adjacent and of equal width, and the height of each bar corresponds to the number of data points that fall within that particular range.\n\nHistograms are useful for visualizing the shape of a dataset, including its central tendency, variability, and potential outliers. They can be used to identify patterns and trends in the data and to highlight any areas of the distribution that may be of interest.\n\nHistograms can also be used to compare the distributions of multiple datasets side-by-side, where each dataset is represented by a separate set of bars. This allows for easy comparison between different datasets and can help identify differences or similarities in the data. The syntax follows as below:\n\n> matplotlib.pyplot.hist(x, bins=None, range=None, density=False, weights=None,histtype='bar', align='mid', orientation='vertical', rwidth=None, log=False, color=None, label=None, stacked=False, *, data=None, **kwargs)\n\n**Parameters:**\n- x: sequence of arrays or arrays themselves\n- bins: The optional parameter contains an array of weights with the same dimensions as the x bottom location of each bin's baseline.\n- range: An optional parameter represents the upper and lower range of bins.\n- density: Boolean values are contained in the optional parameter.\n- weights: This parameter can be an integer, a sequence, or a string.\n- histtype: The type of histogram [bar, bar stacked, step, stepfilled] is an optional parameter; the default is \"bar.\"\n\n\n\n\n\n\n#### **Box Plot**\n\nA boxplot, also known as a box-and-whisker plot, is a type of chart that is used to visualize the distribution of a dataset. It consists of a box that represents the middle 50% of the data, with a vertical line inside the box indicating the median value.\n\nThe box is typically divided into quartiles, with the lower quartile(Q1) represented by the bottom of the box and the upper quartile (Q3) represented by the top of the box. The distance between Q1 and Q3 is called the interquartile range (IQR), and the whiskers (lines extending from the right and left of the box) represent the range of the data that falls within 1.5 times the IQR.\n\nAny data points that fall outside the whiskers are considered outliers and are typically represented as individual points on the chart.\n\nBoxplots are useful for identifying the central tendency, variability, and any potential outliers in a dataset. They can be used to compare the distributions of multiple datasets side-by-side and to identify any differences or similarities in the data.\nThe syntax follows as below:\n> matplotlib.pyplot.boxplot(data, notch=None, vert=None, patch_artist,widths=None)\n\n**Parameters:**\n- data: The data should be an array or sequence of arrays that will be plotted.\n- notch: This parameter accepts only Boolean values, either true or false.\n- vert: This attribute accepts a Boolean value. If it is set to true, then the graph will be vertical. Otherwise, it will be horizontal.\n- widths: It accepts the array of integers which defines the width of the box.\n- patch_artist: this parameter accepts Boolean values, either true or false, and this is an optional parameter.\n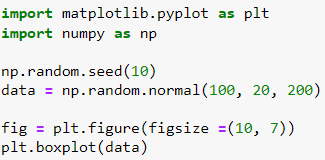\n\n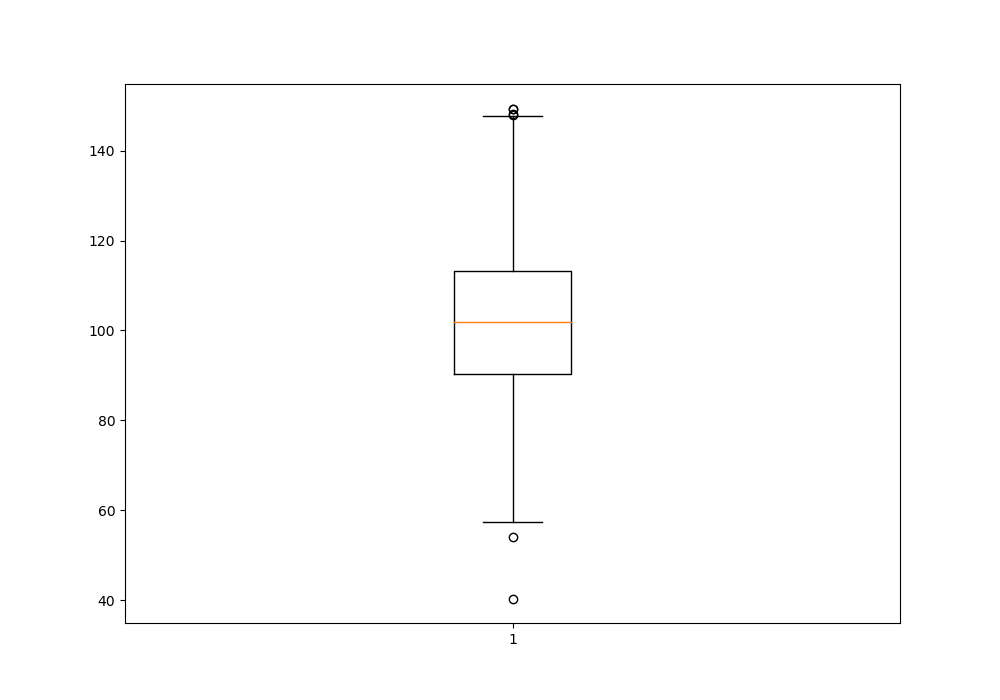\n\n\n#### Introduction to subplots in matplotlib\n\nSubplots are useful when you want to plot multiple data sets on the same figure. \nThere are a number of ways to create subplots in matplotlib. In this tutorial, we will take a look at two of the most common ways: using the subplot() function and using the subplots() function.\n\nWe will also take a look at how to change the size and position of subplots in matplotlib. By the end of this tutorial, you will know how to create subplots in Python using matplotlib!\n\n\n\n\n\n\n\n#### Which One To Use For Data Visualization? (Matplotlib or Seaborn)\n\nAlthough the capabilities of Matplotlib and Seaborn are somewhat different, it ultimately comes down to personal preference when choosing one of them for data visualization.\n\nMatplotlib is the basic go-to option when it comes to creating data visualizations. The wide range of customization options allows it to be used in a variety of scenarios, from basic data plotings to complex interactive plots. It is also great for creating informative graphics that don't require a high level of customization.\n\nMeanwhile, Seaborn is best for anyone who wants to create more aesthetically pleasing visualizations. It comes with a pre-established set of plot styles, which give visualizations a more attractive feel. However, it does not offer a lot of customization options and can fall short of more intricate data representations.\n\nUltimately, users should choose the option that best suits their workflow and the visualizations they would like to create. Matplotlib and Seaborn each have their own advantages and can generate high-quality visualizations in different circumstances.\n\n#### Conclusion\n\nIn this blog, we learned about the introduction to matplotlib library. We saw how to install matplotlib and how we visualized the different plot types. Matplotlib and Seaborn are two popular data visualization tools, but it ultimately comes down to personal preference.\nHistograms and boxplots are two types of charts used to visualize the distribution of a dataset. Histograms are used to identify patterns and trends, while boxplots are used to compare the distributions of multiple datasets.\n\n\n","blog_slug":"matplotlib","published_date":"15 June 2023"}]},{"name_and_surname":"Vijay Shanthagiri","short_description":"Vijay is a Data Scientist & Mentor with Analogica. He is the founder of Certisured.com an ed-tech platform focussed on creating industry recognized certifications by combining excellent education with authoratative assessments. ","twitter_url":"https://www.linkedin.com/in/vijay-shanthagiri/","linkedin_url":"https://www.linkedin.com/in/vijay-shanthagiri/","designation":"Founder & CEO - Certisured.com","image":{"localFile":{"childImageSharp":{"gatsbyImageData":{"layout":"constrained","backgroundColor":"#080808","images":{"fallback":{"src":"/static/2b218051f25c235bc03ec67b443f53b5/ae1c8/Vijay_Shanthagiri_Certisured_com_2fe2cabba4.png","srcSet":"/static/2b218051f25c235bc03ec67b443f53b5/08932/Vijay_Shanthagiri_Certisured_com_2fe2cabba4.png 270w,\n/static/2b218051f25c235bc03ec67b443f53b5/1fa44/Vijay_Shanthagiri_Certisured_com_2fe2cabba4.png 540w,\n/static/2b218051f25c235bc03ec67b443f53b5/ae1c8/Vijay_Shanthagiri_Certisured_com_2fe2cabba4.png 1080w","sizes":"(min-width: 1080px) 1080px, 100vw"},"sources":[{"srcSet":"/static/2b218051f25c235bc03ec67b443f53b5/ede49/Vijay_Shanthagiri_Certisured_com_2fe2cabba4.webp 270w,\n/static/2b218051f25c235bc03ec67b443f53b5/4cb34/Vijay_Shanthagiri_Certisured_com_2fe2cabba4.webp 540w,\n/static/2b218051f25c235bc03ec67b443f53b5/4f506/Vijay_Shanthagiri_Certisured_com_2fe2cabba4.webp 1080w","type":"image/webp","sizes":"(min-width: 1080px) 1080px, 100vw"}]},"width":1080,"height":1080}}}},"blogs":[]},{"name_and_surname":"Bindu Shree.S","short_description":"Bindu completed her U.G. at Aurobindo college. She is a Power BI and SQL Developer. After learning some of the ideas, she explored the tool more and found it fascinating.","twitter_url":"","linkedin_url":"https://www.linkedin.com/in/bindu-shree-185b71255","designation":"Power BI and SQL Developer","image":{"localFile":{"childImageSharp":{"gatsbyImageData":{"layout":"constrained","backgroundColor":"#f8f8f8","images":{"fallback":{"src":"/static/4924589c6b1b43c65f32141329c30355/e3b8b/BINDU_Certisured_2_902094edf2.jpg","srcSet":"/static/4924589c6b1b43c65f32141329c30355/15c21/BINDU_Certisured_2_902094edf2.jpg 86w,\n/static/4924589c6b1b43c65f32141329c30355/9173f/BINDU_Certisured_2_902094edf2.jpg 172w,\n/static/4924589c6b1b43c65f32141329c30355/e3b8b/BINDU_Certisured_2_902094edf2.jpg 344w","sizes":"(min-width: 344px) 344px, 100vw"},"sources":[{"srcSet":"/static/4924589c6b1b43c65f32141329c30355/77098/BINDU_Certisured_2_902094edf2.webp 86w,\n/static/4924589c6b1b43c65f32141329c30355/1fb84/BINDU_Certisured_2_902094edf2.webp 172w,\n/static/4924589c6b1b43c65f32141329c30355/33ff0/BINDU_Certisured_2_902094edf2.webp 344w","type":"image/webp","sizes":"(min-width: 344px) 344px, 100vw"}]},"width":344,"height":303}}}},"blogs":[{"title":"Functions you should be familiar with in Power BI’s DAX Language.","Descrption":"#### DAX in Power BI\nThe formulas, functions, operators, and constants that makeup data analysis expressions are what let a user build custom tables, dimensions, and measurements. In addition to returning one or more values, they are used to resolve data analysis issues by establishing new connections between various data variables.
\n\nData analysts may carry out complex calculations and find a hidden pattern in unstructured datasets thanks to the DAX Language, which is quite helpful. A function or nested function with conditional expressions, value references, formulae, loops, and other elements always makes up an expression's whole source code. As they are judged from an expression's interior to outermost function, it is crucial to formulate them correctly.
\n\n**There are two primary data types in Power BI DAX Functions:**\n- **Numeric:** These data types include decimals, integers, currency values, etc.\n- **Non-numeric:** It consists of strings and binary objects, etc.
\n\n\n#### Importance of DAX in Power BI\n\nIt’s important to learn the DAX functions in Power BI as they help you to implement the functionalities like data transformation and visualization with basic knowledge of the Power BI interface, you can create decent reports and share them online. However, for calculations and dimensional analysis, you need to know how Power BI DAX functions are carried out.
\n\nFor Example, you can calculate the growth percentage and visualize the growth percentage in different regions of a Country to compare the data over the years. DAX in Power BI helps a designer create new measures, which in turn helps a business to identify the problems and find appropriate solutions.
\n\n#### DAX Formula – Syntax\n\nYou can grasp any language with ease by breaking a statement down into its component parts. You should learn these expressions' syntax so that you can build new ones that meet your needs.\n\n> **Test Column = [Units Sold] * [Manufacturing Price] [Segment]**\n\nIt represents a Formula used to create new columns by multiplying the values of the other columns. Let’s understand clearly what each element does:\n- **Test Column:** It indicates the name of the new measure.\n- **(=) Sign:** It indicates the starting of your DAX Formula.\n- **[Units Sold] and [Manufacturing Price]:** These two are the arguments or columns whose values are used to generate the output.\n- **(*):** The * operator multiplies the values of the two-column variables.\n- **[Segment]:** It represents the classification of the corresponding formula. Unlike regular columns, the calculated columns are necessary to have at least one.\n\n#### DAX Functions Types\n there are several types of functions, including:\n- **Scalar functions** operate on a single value and return a single value. Examples of scalar functions include SUM, AVERAGE, and MAX.\n- **Table functions** operate on a table and return a table or a table expression. Examples of table functions include FILTER, SUMMARIZE, and ADDCOLUMNS.\n- **Iterator functions** perform an operation on each row of a table and return a result. Examples include SUMX and AVERAGEX.\n- **Logical functions** test conditions and return a Boolean value (TRUE or FALSE). Examples include IF and AND.\n- **Information functions** return information about the environment or context in which they are used. Examples include USERNAME and SELECTEDVALUE.\n- **Filter functions** filter a table based on certain conditions. Examples include ALL and VALUES.\n\n#### DAX Calculation Types\n Two different types of calculations or formulas can be utilized with DAX in Power BI to produce a resulting value from input values.\n- **Calculated Columns:** New columns can be combined with existing ones using calculated columns and filters. Power BI Desktop's Modeling Page allows for the creation of additional columns by inputting the names and formulas for those columns.\n- **Calculated Measures:** The user can build fields using aggregate values such as average, ratio, and percentage, among others, using Measures. The measurements are generated from Power BI Desktop's modeling page, just the way computed columns are.\n\n#### DAX Functions\nDAX Functions in Power BI are the predefined formulas used to calculate the arguments in a function, executed in a particular order. These arguments could be numbers, constants, texts, other functions or formulas, and logical values such as True or False. The Functions perform a particular operation on one or more arguments in a DAX formula. Below are some key points of DAX Functions\n- When using DAX functions in Power BI, a full field, column, or table is always referenced rather than a single value. To use DAX functions on specific values, you must first establish filters within the DAX formula.\n- To determine the time and date ranges, DAX uses the Time Intelligence function. These functions will be covered in more detail below.\n- Without using any filters, single rows can also have DAX functions applied to them. Depending on the context of each row, the computations can be used.\n- The whole table may occasionally be returned by these procedures, which can be utilized as input by other Power BI DAX operations.\n\n \n#### Here are a few functions that are commonly used in DAX\n\n- **Total Quantity = SUM(Sales[Quantity])** - This measure calculates the total quantity of items sold by summing the values in the Quantity column of the Sales table.\n- **Average Price = AVERAGE(Sales[Price])** - This measure calculates the average price of items sold by averaging the values in the Price column of the Sales table.\n- **Lowest Price = MIN(Sales[Price])** - This measure returns the lowest price of any item sold by finding the minimum value in the Price column of the Sales table.\n- **Highest Price = MAX(Sales[Price])** - This measure returns the highest price of any item sold by finding the maximum value in the Price column of the Sales table.\n- **Number of Products = COUNT(Sales[Product])** - This measure counts the number of different products sold by counting the number of unique values in the Product column of the Sales table.\n- **Quantity Classification = IF(Sales[Quantity] > 10, \"High\", \"Low\")** - This measure returns \"High\" if the quantity of an item sold is greater than 10, and \"Low\" if it is not.\n- **Today's Date = TODAY()** - This measure returns the current date.\n- **Current Time = NOW()** - This measure returns the current date and time.\n- **Current Month = MONTH(TODAY())** - This measure returns the current month by using the MONTH function on the result of the TODAY function, which returns the current date.\n- **Current Year = YEAR(TODAY())** - This measure returns the current year by using the YEAR function on the result of the TODAY function, which returns the current date.\n\n\n\n\n\n\n\n","blog_slug":"functions-you-should-be-familiar-with-in-power-bi-s-dax-language","published_date":"7 Jan 2023"}]},{"name_and_surname":"KC Mahendra","short_description":"Full stack developer having 4 years of industrial experience in designing, development and maintenance of web apps based on Django-Python platforms.worked with different types of relational database(RDBMS) like: Sqlite,mysql,oracle","twitter_url":"","linkedin_url":"","designation":"Data Product Developer","image":{"localFile":{"childImageSharp":{"gatsbyImageData":{"layout":"constrained","backgroundColor":"#f8f8f8","images":{"fallback":{"src":"/static/d55146ca123f0295063ffd2b5b36aaac/dcc8b/Certisured_edtech_id_portrait_0db21ef82d.jpg","srcSet":"/static/d55146ca123f0295063ffd2b5b36aaac/012f7/Certisured_edtech_id_portrait_0db21ef82d.jpg 100w,\n/static/d55146ca123f0295063ffd2b5b36aaac/f6a02/Certisured_edtech_id_portrait_0db21ef82d.jpg 200w,\n/static/d55146ca123f0295063ffd2b5b36aaac/dcc8b/Certisured_edtech_id_portrait_0db21ef82d.jpg 399w","sizes":"(min-width: 399px) 399px, 100vw"},"sources":[{"srcSet":"/static/d55146ca123f0295063ffd2b5b36aaac/72d10/Certisured_edtech_id_portrait_0db21ef82d.webp 100w,\n/static/d55146ca123f0295063ffd2b5b36aaac/9c538/Certisured_edtech_id_portrait_0db21ef82d.webp 200w,\n/static/d55146ca123f0295063ffd2b5b36aaac/73a4e/Certisured_edtech_id_portrait_0db21ef82d.webp 399w","type":"image/webp","sizes":"(min-width: 399px) 399px, 100vw"}]},"width":399,"height":489.00000000000006}}}},"blogs":[{"title":"Let’s talk about MVT Architecture in Django","Descrption":"Django web framework has a model-view-template (MVT) architecture, which makes it the only framework you’ll need to create a complete website or web application. This Python framework allows you to create models that generate databases and render dynamic HTML templates to the UI using views. \n\n**Workflow of MVT Architecture**\n\n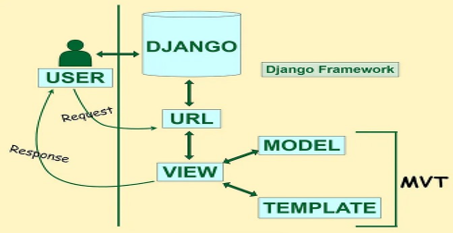\n\n\nThe **Model** manages the data and is represented by a database. A model is basically a database table. The model is responsible for handling all data-related tasks. It can be a table in a database, a JSON file, or anything else. The model takes the data from where it is stored and then processes it before sending it to the view. If the model needs to be changed, it is done in a single place. In a web-based application, the model is the place where data is transformed from one format to another.\n\nThe **View** receives HTTP requests and sends HTTP responses. A view interacts with a model and template to complete a response. The View is the user interface — what you see in your browser when you render a website. It is represented by HTML/CSS/Javascript and Jinja files. A view is used to display the data from the model component. It can also be used to collect data from the user and send it to the Model as a form input. In this way, the View component contains the UI logic.\n\nThe **Template** is basically the front-end layer and the dynamic HTML component of a Django application. A template is nothing but the front-end components of a Django application. It contains the static HTML output of the webpage as well as the dynamic information. To generate HTML dynamically Django uses DTL(Django Template Language) along with static HTML. Using DTL Django is able to show data from models dynamically.\n\nIn simple you want to explain MVT Architecture A user searches for a URL pattern that is nothing but a request for a certain web page. After sending the request to the server Django will search for the corresponding view for this request. The view will talk to the model and template to create a complete response for the request. So mainly the MVT structure together creates a response for a corresponding request.\n\n\n\n","blog_slug":"let-s-talk-about-mvt-architecture-in-django","published_date":"15 April 2023"},{"title":"Importance of ORM in Django Frameworks","Descrption":"### **ORM(object-relational mapper)**\nORM is an acronym for the **object-relational mapper**. The ORM’s main goal is to transmit data between a relational database and an application model. The ORM automates this transmission, such that the developer need not write any SQL. The Django web framework includes a default object-relational mapping layer (ORM) that can be used to interact with data from various relational databases such as SQLite, PostgreSQL, MySQL, and Oracle. Django allows us to add, delete, modify, and query objects, using an API called ORM. An object-relational mapper provides an object-oriented layer between relational databases and object-oriented programming languages without having to write SQL queries. It maps object attributes to respective table fields. It can also retrieve data in that manner. This makes the whole development process fast and error-free.\n\n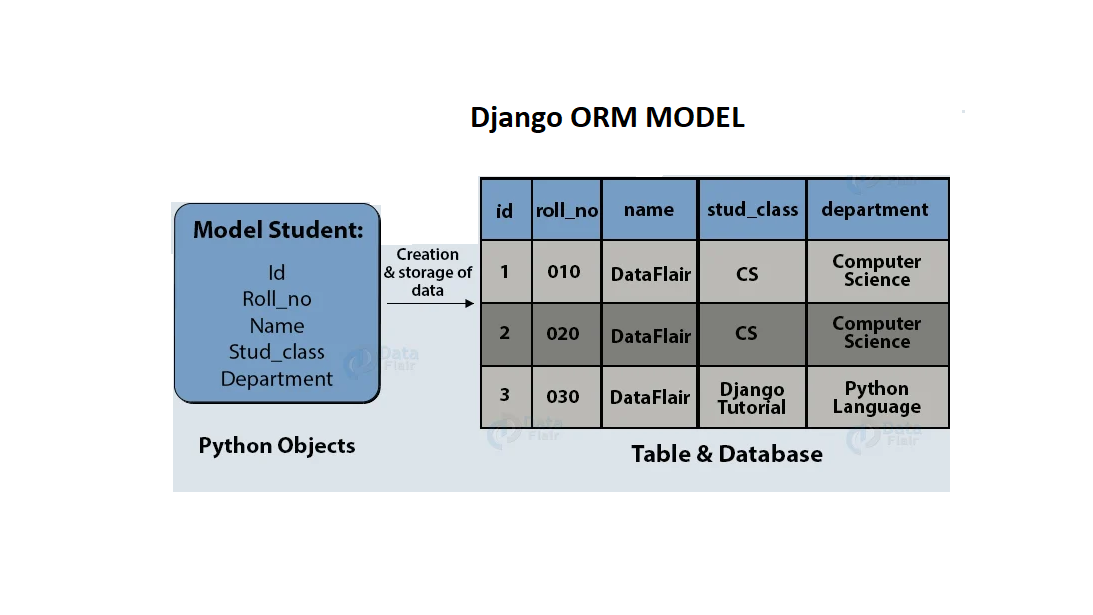\n\n\nIn the above image, we have some Python objects and a table with corresponding fields. The object’s attributes are stored in corresponding fields automatically. An ORM will automatically create and store your object data in the database. You don’t have to write any SQL for the same.\n\n### **The Problem Solved by ORM**\n\nORMs have certain benefits over the traditional approach. The main advantage ORMs provide is rapid development. ORMs make projects more portable. It is easier to change the database if we use ORMs.\n\n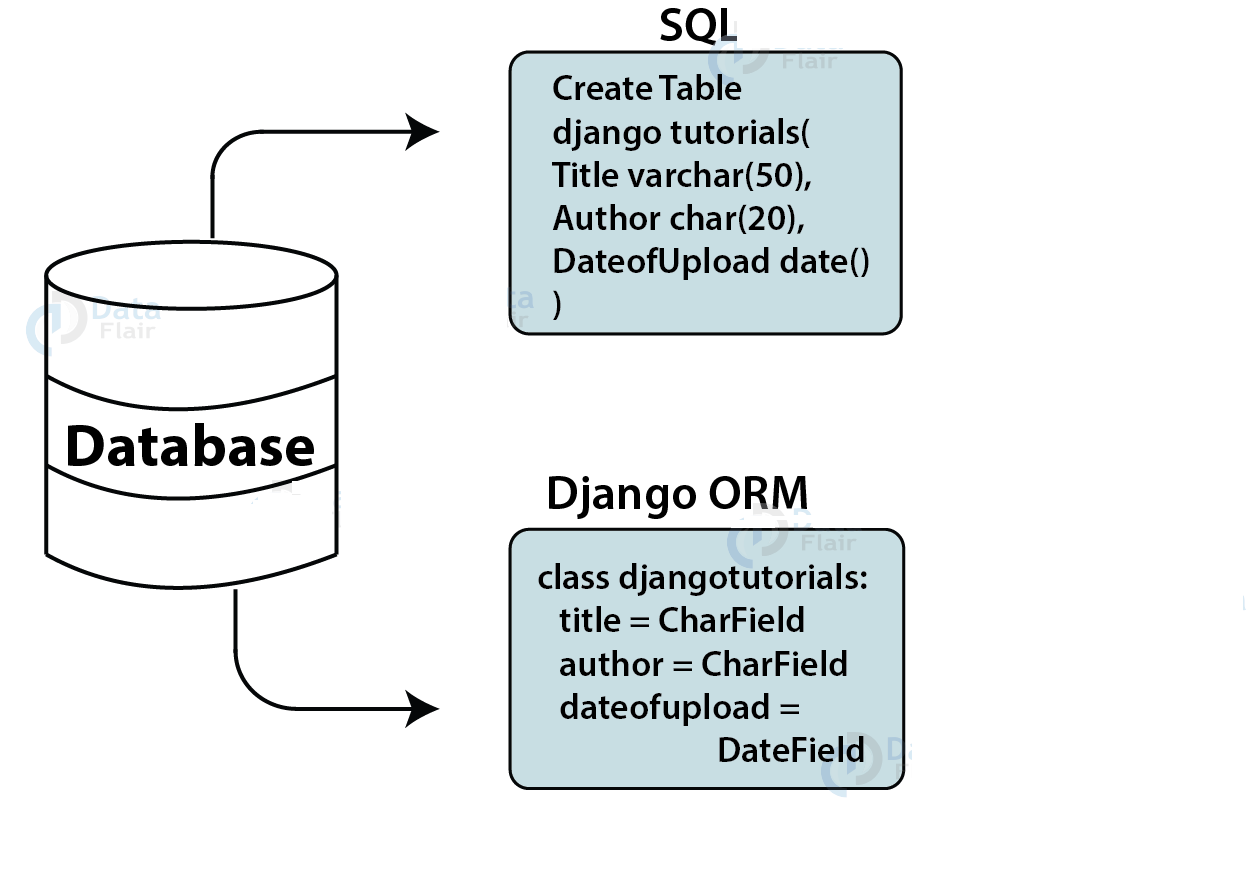\n\n\nIn the past, web developers needed to have knowledge of databases too. A database has been an important component from the start. The programming languages used for web development use classes and objects for data interpretation. The class is used to define data structure in web applications. Then the same database schema is created in the database. This task requires skill and knowledge of SQL.\n\nKnowing SQL is also not enough since SQL implementations slightly differ from one another in different databases. This became a difficult and time-consuming task. So, to resolve this, the concept of ORM was introduced in web frameworks. ORMs automatically create a database schema from defined classes/ models. They generate SQL from Python code for a particular database. ORMs let the developer build the project in one language which means Python. This increased the popularity of ORMs and web frameworks. These ORMs use connectors to connect databases with a web application. You must install the connector of a specific database you want to work with.\n\n### **How the ORM works?**\n\nIn the following section, we will see how ORM works. We will be using the following Django Models for demonstration:\n\n\n\nIn the above code, we created two models Album and Song. Whenever an instance of a model is created in Django, it will display the object as Modelname Object(1) in the admin interface. Hence to change the display name we use the function def __str__(self). The Strfunction in a Django model returns a string that is rendered as the display name of instances for that model. In our case, it will display the name of the title for the Model Album and the name of the song for the Model Song. In the Model Song, we are linking the second field, an album with the Model Album. Register the model in the admin.py file,\n\n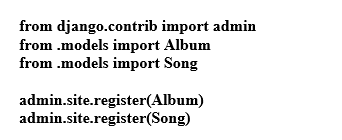\n\nAfter creating and registering the models, we need to use the following command:\n* **iPython manage.py make migrations**\n* **Python manage.py migrate**\n\nIn the above commands, make migrations is responsible for packing up the changes into individual migration files, and migrate is responsible for applying those to our database. Now we need to access Django ORM, it can be accessed by using the following command inside our project directory:\n\n In the above commands, makemigrations is responsible for packing up the changes into individual migration files, and migrate is responsible for applying those to our database.\nNow we need to access Django ORM, it can be accessed by using the following command inside our project directory:\n\n* **python manage.py shell**\n\nThis leads us to an interactive Python console. Next, we are supposed to import our models using the following command:\n\n* **from playlist.models import Song, Album**\n\nAfter this, we can perform ORM operations.\n\n### **Django ORM- Inserting, Retrieve Data:**\n\nDjango lets us interact with its database models using an API called ORM. In this section, we will discuss some useful operations like adding, updating, and deleting data using Django ORM.\n•\tAdding Objects\nWe write the following code to create and save an object of Model Album:\n\n* **a = Album.objects.create(title=\"Add\", artist=\"Sheeran\", genre=\"Pop\")**\n* **a.save()**\n\nWe write the following code to create and save an object of Model Song:\n\n* **s = Song.objects.create(name=\"Castle\", album=a)**\n* **s.save()**\n\nRetrieving stands for getting the result of the search we make. So for retrieving the data in Django, let us add some records for ease of explanation.\n\nDjango, let us add some records for ease of explanation.\n* **a = Album.objects.create(title=\"Add\", artist=\"Sheeran\", genre=\"pop\")**\n* **a.save()**\n* **a = Album.objects.create(title=\"Abstract Road\", artist=\"The Beatles\", genre=\"rock\")**\n* **a.save()**\n* **a = Album.objects.create(title=\"Run evolver\", artist=\"The Beatles\", genre=\"slow\")**\n* **a.save()**\n\nTo retrieve all the objects of a model,all()is used:\n\n* **Album.objects.all()**\n \n*
\nThe elbow method is a technique used in K-means clustering to find the optimal number of clusters (K) for a given dataset. The basic idea is to run the K-means algorithm for a range of K values and plot the within-cluster sum of squares (WCSS) ,WCSS is the sum of the squared distance between each point and the centroid in a cluster. against the number of clusters.\n\n\nWhen we plot a graph of Within-Cluster Sum of Squares (WCSS) against the number of clusters K . The graph looks like a bent arm. At first, as we increase the number of clusters, the WCSS goes down. The WCSS is the highest when we have only one cluster . If we look closely at the graph, there's a point where it noticeably changes shape, creating a bend like an elbow. After this point, the graph moves kind of straight along the bottom. The number of clusters we see at this elbow point is the best choice for getting meaningful clusters from our data.\n\n\n***Advantages of the Elbow Method:***
\n1.Easy to understand and implement by seeing the plot and look the “elbow point”.
\n2.When clusters are clearly defined elbow method is visible
\n3.There is no need of calculating within-cluster sum of squares (WCSS) ,we can use built in support for calculation \n
\n***Disadvantages of the Elbow Method:***
\n1.The elbow may not appear clearly when clusters are not well – separated.
\n2.Most effective with algorithms like K- means but not suitable for all clustering approaches.
\n3.A low WCSS doesn’t mean good clustering – it might just reflect increasing model complexity.\n\n\nThe curve looks like an elbow. In the above plot, the elbow is at k=3 (i.e., the Sum of squared distances falls suddenly), indicating the optimal k for this dataset is 3. \n\n**2. Silhouette Analysis**\nThe Silhouette Method is a technique used to assess the quality of clusters in a dataset. It provides a way to measure how well-separated and distinct the clusters are, helping to determine the optimal number of clusters (K) in clustering algorithms.\nStep involved in calculation silhouette scores are:\nStep1: Select Range of values K\nStep2:Calculate Silhouette Score for every k\nAssume the data have been clustered via any technique, such as K-Means into k clusters\nThe equation for calculating the silhouette Score for a each data point:\n\n\n\n\n\n\n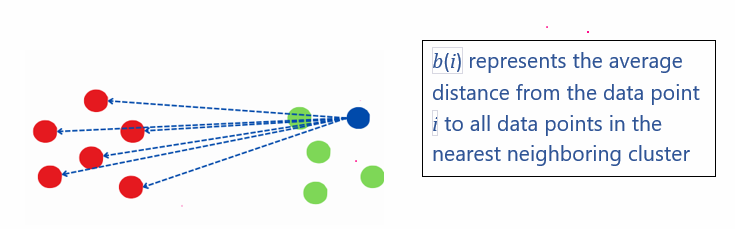\nStep 3: Plot the silhouette scores\n You can visualize the silhouette scores by plotting them against their respective K values. This graphical representation aids in identifying the juncture where the silhouette scores begin to stabilize.\nConsiderations When Calculating Silhouette Coefficient:\nThe value of the silhouette coefficient is between [-1, 1].\nPositive scores indicate that points within clusters are well-matched, while negative scores suggest potential misplacements. \nAn average silhouette width above 0.7 is considered strong, 0.5 is considered reasonable, and 0.25 is considered weak.\n\n\nObserving the analysis, we find that the silhouette score reaches its maximum at k = 3. Therefore, we opt for 3 clusters.\n\n***Advantages of the Silhouette Method:***
\n1.Provides a numerical score between -1 and 1 , allowing for qualitative comparison between different values of k.
\n2.A higher silhouette score indicates well-separated , dense clusters , which is easy to understand and compare
\n3.Can be applied with various clustering techniques eg: k-means,DBSCAN
\n***Disadvantages of the Silhouette Method:***
\n1.Requires distance calculations between all pairs of points and cluster centroids – expensive for a large dataset.
\n2.The outcome may change significantly depending on whether Euclidean, Manhattan or other metrics are used.
\n\n\n## **Conclusion
**\n In conclusion, employing the elbow method revealed that utilizing 3 clusters is optimal for our dataset. To further validate this choice, the silhouette method confirmed that a configuration with 3 clusters is suitable. This comprehensive approach involving both the elbow and silhouette methods provides a robust strategy for determining the optimal number of clusters in clustering algorithms, showcasing its effectiveness in cluster analysis.\n\n\n\n\n\n\n","blog_slug":"cluster-crafting","published_date":"May 6th , 2025"},{"title":"Unlocking the Potential of Data Analysis with Excel","Descrption":"Introduction:
\nWhat I Think:
\nSection 1: Data Visualization
\nSection 2: Pivot Tables
\nSection 3: Dynamic Arrays
\nSection 4: Formula Auditing
\nSection 5: Conditional Formatting
\nSection 6: Chart Types
\nSection 7: Data Cleaning
\nSection 8: Error Checking
\nConclusion
\n\n
Excel can be used effectively in a variety of industries and is widely adopted due to its user-friendly design and adaptability, which make it accessible to both beginner and experienced analysts. Excel offers the versatility and functionality required to transform data into actionable intelligence, regardless of the complexity of the problem you are trying to solve.
\n\n**1.Feature Creation :** Creating Some useful features using domain knowledge or observing the patterns or merging the current features to create new features, which improves the model performance of a machine learning model.\n\n**2.Feature Transformation :** The process of changing the features into a representation that the machine learning model can use better is called feature transformation. In order to convert the values of a given column (feature) and prevent computational errors by ensuring that all features fall within the model's permitted range or scale using statistical methods.\n\n**3.Feature Extraction:** Feature Extraction is a extracting a new features using existing features without changing the important information or the original relationships. feature extraction will reduce the data dimensionality without losing a relevant information using dimensionality reduction like PCA.\n\n**4.Feature Selection:** Feature selection is the process of selecting or identifying a features that are relevant to improve the model’s performance and interpretability using statistical techniques which helps in finding the relation between features and target vector is correlation, univariate feature analysis.\n\n\nThe steps involved in Feature Engineering
\n**1.Imputation:** One of the most frequent issues encountered while preparing your data for machine learning is missing values. One technique for handling missing values is imputation.\n\n\nTwo categories of imputations exist:
\n\n- **Numerical imputation:** When specific data points are unavailable, numerical imputation is used to fill the missing values with statistical measures like mean, median\n\n\n- **Categorical Imputation:** When specific data points are unavailable, Categorical imputation is used to fill the missing values with highest value or mode\n\n\n**2.Handling Outliers:**
\n\nOutlier (extreme high value or low value) treatment is the process of removing outliers from the data set. More accurate data representations can be obtained by applying this strategy at different levels. This stage needs to be completed before starting the model training process. One might utilise the Z-score and standard deviation to find outliers. Outliers can be dealt with in a few different ways: \n\n- **Removal:** Items containing outliers are eliminated in order to tidy up the distribution. \n- **Replacing Values:** Using the proper imputation, outliers can be replaced with similar missing data. \n- Capping is the process of substituting a random value or one from a flexible range for the highest and lowest values. \n\n**3. One-Hot Encoding**
\n\nOne method for converting categorical data into numerical values that machine learning models can use is called one-hot encoding. Using this method, every category is converted into a binary value that indicates whether it exists or not. Take the categorical variable \"Colour,\" for instance, which has three categories: Green,White and Black. This variable would be converted into three binary variables Color_Green , Colour_white, and Colour_Black—by one-hot encoding. The values of each variable would be 1 in the case that the matching category is present and 0 in the absence of it.\n\n**4.Scaling:** To improve model performance, standardise or normalise numerical features to make sure they are on a similar scale. There are two common approaches to scaling: \n\n- **Normalisation:** It involves scaling all values inside a specific range between 0 and 1.
\n- **Z-scores:** this is another name for standardisation. It is the act of measuring something while keeping the standard deviation in mind.\n\n**5.Transformers:** The most popular method among data scientists is log transform. Its main application is to change a skewed distribution from skewed to less skewed or normal. In this transform, the values in a column that we take the log are used as the column. Data that is difficult to understand is handled by it, and it becomes closer to what is needed for typical applications.\n\n**6.Binning:** which results from using excessive parameters and incorrect data. One way to transform continuously fluctuating variables into categorical variables is through binning. During this process, the range of values of the continuous variable is separated into many bins, each of which is assigned a category value.\nSuppose that we wish to group or bin the ages of the individuals in a dataset that contains their ages.\nGrouping Ages We wish to make age divisions:\n\n0–20 years , 21–30 years,31–40 years,41–50 years,51–60 and 61–70 years old\n\n**7. Text Data Processing:** When working with text data, carry out operations such stop word removal, stemming, and tokenisation.\n\nA critical stage in the data preprocessing pipeline is feature engineering, which turns unprocessed data into useful features that enhance machine learning model performance. We can completely utilize our data by carefully choosing, developing, and polishing features, which will result in more reliable and accurate models. Every technique is essential to getting the data ready for analysis, from handling missing values and encoding categorical categories to scaling and normalising the data.\n","blog_slug":"feature-engineering-an-complete-guide-to-transforming-raw-data-1","published_date":"11th June 2025"}]},{"name_and_surname":"Vandana Hanji ","short_description":"Vandana is a dedicated individual with a passion for digital marketing. She completed her undergraduate studies at Rani Channamma University. Throughout her academic journey, Vandana has shown great enthusiasm for learning the latest trends and techniques in the world of digital marketing. With her strong foundation in digital marketing and continuous exploration of innovative tools and strategies, Vandana is poised to excel in her career and make a significant impact in the ever-evolving digital landscape.","twitter_url":null,"linkedin_url":"https://www.linkedin.com/in/vandana999a2023","designation":"Digital event manager at Analogica Software Dev Pvt Ltd","image":{"localFile":{"childImageSharp":{"gatsbyImageData":{"layout":"constrained","backgroundColor":"#68b8e8","images":{"fallback":{"src":"/static/f01b99f7c81f084a19c7d3c84923c503/160ed/vandana_73599301a0.jpg","srcSet":"/static/f01b99f7c81f084a19c7d3c84923c503/02267/vandana_73599301a0.jpg 71w,\n/static/f01b99f7c81f084a19c7d3c84923c503/37058/vandana_73599301a0.jpg 142w,\n/static/f01b99f7c81f084a19c7d3c84923c503/160ed/vandana_73599301a0.jpg 284w","sizes":"(min-width: 284px) 284px, 100vw"},"sources":[{"srcSet":"/static/f01b99f7c81f084a19c7d3c84923c503/ea996/vandana_73599301a0.webp 71w,\n/static/f01b99f7c81f084a19c7d3c84923c503/56183/vandana_73599301a0.webp 142w,\n/static/f01b99f7c81f084a19c7d3c84923c503/b2d89/vandana_73599301a0.webp 284w","type":"image/webp","sizes":"(min-width: 284px) 284px, 100vw"}]},"width":284,"height":323}}}},"blogs":[{"title":"What is domain authority and Why does it matters","Descrption":"### Introduction\n\nDomain Authority (DA) is a numerical measure used to evaluate the credibility and influence of a website on the internet. It is a search engine ranking score developed by Moz, a popular SEO (Search Engine Optimization) company. In simple terms, it helps determine how likely a website is to rank higher in search engine results.\n\nThe score ranges from 1 to 100, with higher numbers indicating a stronger and more reputable website. Several factors contribute to a website's domain authority, such as the number of high- quality backlinks it has from other trustworthy websites, the overall content quality, and the\nwebsite's overall age and history.\n\nyou can think of Domain Authority as a popularity score for a website, where a higher score means the website is more likely to be considered a reliable and trustworthy source of information. Websites with a high domain authority are often preferred by search engines like Google, making them more visible to users when they search for relevant topics.\n\n### Here are few interesting points about domain authority\n\n- Domain Authority (DA) is a numerical score that shows how trustworthy and influential a website is\n- It ranges from 1 to 100, with higher scores indicating more credibility.\n- DA is determined based on factors like the number and quality of websites linking to the website in question.\n- Websites with higher DA are more likely to rank higher in search engine results.\n- It helps users and search engines identify reliable and valuable sources of information.\n- DA is a metric created by Moz, an SEO company, to assess a website's reputation.\n- Websites with strong content and high-quality backlinks tend to have higher DA scores.\n- DA is not an absolute measure of accuracy, but it helps gauge a website's overall credibility.\n- Search engines like Google use DA as one of many factors to determine search result rankings.\n- For a website to improve its DA, it needs to focus on producing valuable content and gaining links from reputable websites.\n\n### Why does domain authority matter\n\nDomain Authority (DA) matters because it helps us separate trustworthy and reliable websites from less credible ones on the internet. In today's digital world, where there is a vast amount of information available, it can be challenging to know which websites to trust. That's where DA comes in.\n\nDomain Authority helps us identify websites that have earned the trust of other websites. Websites with higher DA scores have proven themselves to be valuable and reputable sources of information. They likely have well-researched content, and other reputable websites link to them because they find them helpful and reliable.\n\nFor students doing research or anyone searching for reliable information online, paying attention to Domain Authority can be a useful tool. It can save us time and help us find trustworthy sources that support our learning and understanding of various topics. So, understanding and using Domain Authority can significantly improve our internet experience and ensure we rely on information that we can trust.\n\n### Example:\n\nLet's imagine a school competition where students are creating websites to share information about their hobbies. One of the students, Rohit , has a website about photography, and another student, Sarah, has a website about gardening.\nNow, the teachers in charge of the competition want to know which websites are more likely to be trustworthy and reliable sources of information.\nThey decide to use \"Domain Authority\" to help them figure this out.\n\n\nDomain Authority is like a popularity score for websites. It tells us how much other websites trust and respect a particular website.\n\nFor example, if rohit’s photography website has lots of other photography websites linking to it (like saying, \"Hey, this website has great photography tips!\"), it will have a high Domain\n\nAuthority score. That means many other websites consider it reliable and valuable.\n\n\nOn the other hand, if Sarah's gardening website has only a few websites linking to it, it might have a lower Domain Authority score. It's not that her website is bad; it's just that fewer people know about it and recommend it to others.\n\nHaving a high Domain Authority doesn't mean the information on a website is always correct, but it's a good indicator that the website is more likely to be reliable and helpful for those\nlooking for information on a specific topic\n\nDomain Authority is like a popularity score for websites. It tells us how much other websites trust and respect a particular website.\n\n\n\n### Conclusion:\n\nWhen we use search engines, websites with higher DA often appear at the top of the results, making it easier for us to find reliable sources for our research and learning. So, understanding Domain Authority can help us make better decisions while browsing the web and ensure we rely on credible information.","blog_slug":"what-is-domain-authority-and-why-does-it-matters","published_date":"04 August 2023"}]},{"name_and_surname":"Divya R","short_description":"Divya R, a Digital Marketing Manager, has a wealth of knowledge in PPC, social media, content generation and AI. Her expertise helps brands thrive in the digital realm.","twitter_url":"https://twitter.com/Divyagowda397?t=4GvfyoZEGAYDnxKH-nY-JQ&s=09","linkedin_url":"https://www.linkedin.com/in/divya-gowda-1172bb213","designation":"Digital Marketing Manager at Analogica Software Dev Pvt Ltd","image":{"localFile":{"childImageSharp":{"gatsbyImageData":{"layout":"constrained","backgroundColor":"#382818","images":{"fallback":{"src":"/static/ea4ebbded59f191674910f266b58cf54/6f09d/Divya_57e1358775.jpg","srcSet":"/static/ea4ebbded59f191674910f266b58cf54/0108e/Divya_57e1358775.jpg 118w,\n/static/ea4ebbded59f191674910f266b58cf54/c556b/Divya_57e1358775.jpg 237w,\n/static/ea4ebbded59f191674910f266b58cf54/6f09d/Divya_57e1358775.jpg 473w","sizes":"(min-width: 473px) 473px, 100vw"},"sources":[{"srcSet":"/static/ea4ebbded59f191674910f266b58cf54/a41e1/Divya_57e1358775.webp 118w,\n/static/ea4ebbded59f191674910f266b58cf54/8d99e/Divya_57e1358775.webp 237w,\n/static/ea4ebbded59f191674910f266b58cf54/6e540/Divya_57e1358775.webp 473w","type":"image/webp","sizes":"(min-width: 473px) 473px, 100vw"}]},"width":473,"height":443.99999999999994}}}},"blogs":[{"title":"This is why you might lose Digital Marketing jobs","Descrption":"Artificial intelligence (AI) is rapidly transforming the digital marketing landscape. Marketers who fail to adopt this technology risk being left behind. In this blog, we discuss why digital marketers should embrace AI and how AI can be used to enhance marketing efforts.\n\nDigital marketers lacking AI support may find it challenging to keep up with algorithm changes, leading to lower reach and engagement. By leveraging AI, marketers can stay nimble and ensure their strategies remain effective even in the face of algorithmic shifts.\n\nFrom its humble origins, digital marketing has undergone a remarkable transformation. It has progressed beyond simple online advertising to form a complex and multifaceted environment that includes social media, content marketing, SEO, email initiatives, and beyond. This complex network of interconnected platforms and techniques requires precision and effectiveness that traditional methods cannot match.\n\nDo you ever feel overwhelmed by monotonous tasks that drain your time and energy? That's where AI steps in to help. With AI-powered automation, you can delegate those routine duties like managing email campaigns, scheduling social media posts, and nurturing leads. By automating these operations, you are freed up to focus on the more imaginative and strategic aspects of your digital marketing efforts.\n\nAbsolutely! AI's ability to perform routine tasks not only saves time but also ensures consistency and accuracy, leading to better results and overall efficiency in campaigns.\n\nImagine this scenario: you open an email and it greets you by your first name while recommending products that suit your tastes. This enchanting phenomenon is made possible by AI-powered personalization. By scrutinizing user actions, purchasing patterns, and relationships, AI crafts meaningfully personalized encounters that resonate deeply with individuals.\n\nStrong, personalized marketing creates stronger connections with customers and enhances their overall journey. Without AI, manually catering to each individual's preferences at scale would be a monumental challenge.\n\nImagine AI as your data-savvy collaborator. It has the ability to quickly process vast data volumes, spotting trends and patterns that may have otherwise eluded detection. This capability not only enhances the perception of customer actions but also drives the course of strategic choices.\n\nAI-powered analytics can provide valuable insights into the effectiveness of current approaches and areas that require fine-tuning. These insights serve as a critical tool for honing marketing strategies and achieving better results.\n\n Here's an interesting twist - AI can be your creative partner. It helps in creating content, be it blog posts, social media headlines, or video scripts. It can analyze engagement metrics to optimize content for better performance. AI's content creation capabilities can be game-changing, especially when it comes to creating diverse and engaging content that resonates with your audience.\n\nThe digital realm is always evolving and AI is at the forefront of that evolution. It adapts to new trends, technologies, and consumer behaviors, helping to keep your strategies fresh and innovative.\n\nRight, AI's ability to adapt and learn from new trends ensures that your digital marketing efforts remain relevant and aligned with the ever-changing landscape.\n\n### Conclusion\nSo, dear digital marketers, it's clear that AI isn't here to replace you; it's here to empower you.\n\nAdopting AI can enhance your digital marketing prowess by automating tasks, tailoring experiences, providing insights, sharpening your competitive advantage, assisting in content generation, and keeping you ahead of industry trends. \n\nKeep in mind, the evolution of digital marketing is not about handing over jobs to AI; it’s all about using AI to excel in your characters. Are you ready to enter the AI-powered era of digital marketing?\n\nAbsolutely, you're heading down the correct path. Let's take it even further and elevate your understanding.\nTo know more about AI Driven Digital Marketing, Please visit our website: www.certisured.com","blog_slug":"this-is-why-you-might-lose-digital-marketing-jobs","published_date":"09 August 2023"}]},{"name_and_surname":"ANUSHA B V","short_description":"I am Anusha B V pre final-year(7th)sem student of Bachelor of Engineering (ISE), at PESITM,shimogga","twitter_url":null,"linkedin_url":"www.linkedin.com/in/anusha-bv-41579223b","designation":"Intern Student ","image":{"localFile":{"childImageSharp":{"gatsbyImageData":{"layout":"constrained","backgroundColor":"#c86848","images":{"fallback":{"src":"/static/390e50a2f90bd03fedc6298d2c7e6672/46598/Anusha_photo_4932152ad8.jpg","srcSet":"/static/390e50a2f90bd03fedc6298d2c7e6672/b5a48/Anusha_photo_4932152ad8.jpg 209w,\n/static/390e50a2f90bd03fedc6298d2c7e6672/561ca/Anusha_photo_4932152ad8.jpg 418w,\n/static/390e50a2f90bd03fedc6298d2c7e6672/46598/Anusha_photo_4932152ad8.jpg 836w","sizes":"(min-width: 836px) 836px, 100vw"},"sources":[{"srcSet":"/static/390e50a2f90bd03fedc6298d2c7e6672/755bb/Anusha_photo_4932152ad8.webp 209w,\n/static/390e50a2f90bd03fedc6298d2c7e6672/7e511/Anusha_photo_4932152ad8.webp 418w,\n/static/390e50a2f90bd03fedc6298d2c7e6672/2a9ab/Anusha_photo_4932152ad8.webp 836w","type":"image/webp","sizes":"(min-width: 836px) 836px, 100vw"}]},"width":836,"height":775.0000000000001}}}},"blogs":[]},{"name_and_surname":"Certisured","short_description":" Be more than Certified Be Certisured Ranked number 1 for offline and online courses on advanced technology across many websites.","twitter_url":null,"linkedin_url":"https://www.linkedin.com/company/certisured","designation":"","image":{"localFile":{"childImageSharp":{"gatsbyImageData":{"layout":"constrained","backgroundColor":"#f8f8f8","images":{"fallback":{"src":"/static/6ba4c861badf58876911649c30136d02/82c11/Untitled_design_3_430e90bd83.png","srcSet":"/static/6ba4c861badf58876911649c30136d02/2fd20/Untitled_design_3_430e90bd83.png 125w,\n/static/6ba4c861badf58876911649c30136d02/de391/Untitled_design_3_430e90bd83.png 250w,\n/static/6ba4c861badf58876911649c30136d02/82c11/Untitled_design_3_430e90bd83.png 500w","sizes":"(min-width: 500px) 500px, 100vw"},"sources":[{"srcSet":"/static/6ba4c861badf58876911649c30136d02/d66e1/Untitled_design_3_430e90bd83.webp 125w,\n/static/6ba4c861badf58876911649c30136d02/e7160/Untitled_design_3_430e90bd83.webp 250w,\n/static/6ba4c861badf58876911649c30136d02/5f169/Untitled_design_3_430e90bd83.webp 500w","type":"image/webp","sizes":"(min-width: 500px) 500px, 100vw"}]},"width":500,"height":500}}}},"blogs":[]},{"name_and_surname":"ADITHYA R ","short_description":"Myself Adithya R, from Bengaluru. I’m currently pursuing my BE(4th year) at Sambhram Institute of Technology. Also was a part of AI Internship and Large Langauage Model.","twitter_url":"https://www.linkedin.com/in/adithya-r-5a90ba231 ","linkedin_url":"https://www.linkedin.com/in/adithya-r-5a90ba231 ","designation":"AI Internship student","image":{"localFile":{"childImageSharp":{"gatsbyImageData":{"layout":"constrained","backgroundColor":"#080808","images":{"fallback":{"src":"/static/ed1c452b94c48b2e26013335d52d1d30/4e2ac/Adithya_ec4647f49f.jpg","srcSet":"/static/ed1c452b94c48b2e26013335d52d1d30/8597d/Adithya_ec4647f49f.jpg 171w,\n/static/ed1c452b94c48b2e26013335d52d1d30/22d97/Adithya_ec4647f49f.jpg 341w,\n/static/ed1c452b94c48b2e26013335d52d1d30/4e2ac/Adithya_ec4647f49f.jpg 682w","sizes":"(min-width: 682px) 682px, 100vw"},"sources":[{"srcSet":"/static/ed1c452b94c48b2e26013335d52d1d30/98190/Adithya_ec4647f49f.webp 171w,\n/static/ed1c452b94c48b2e26013335d52d1d30/d368c/Adithya_ec4647f49f.webp 341w,\n/static/ed1c452b94c48b2e26013335d52d1d30/bc00b/Adithya_ec4647f49f.webp 682w","type":"image/webp","sizes":"(min-width: 682px) 682px, 100vw"}]},"width":682,"height":657}}}},"blogs":[{"title":"Decoding Correlation vs Covariance: Key Variations Unveiled","Descrption":"## **Introduction**
\n\nIn an increasingly information-pushed global environment, the potential to apprehend, examine, and draw meaningful insights from statistics has grown to be an essential ability. Two statistical principles that lie on the heart of statistics analysis are correlation and covariance. These concepts are more than just mathematical abstractions; they may be effective tools that assist us unravel the complex relationships among variables and make informed selections in various fields, from finance to healthcare to clinical studies.\n
\nIn this complete blog, we embark on an adventure to demystify the intricate international of correlation and covariance, exploring their definitions, calculations, programs, and the critical distinctions that set them apart. Whether you're a pro facts scientist, a curious pupil, or a professional in search of enhancing your statistical literacy, knowledge of those concepts is critical for extracting significant insights and making informed decisions from facts.
\nAs we delve into the depths of correlation and covariance, we will find their mathematical underpinnings, decipher their actual-international relevance via realistic examples, and equip you with the know-how and equipment to leverage these principles successfully. By the cease of this adventure, you'll no longer handily draw close the important differences between correlation and covariance but also apprehend whilst and the way to observe them for your analytical endeavors. So, permit's embark in this exploration and unlock the doors to a deeper understanding of the facts-pushed world that surrounds us.
\n\n\n## **Correlation
**\n\nCorrelation is a statistical concept that lies at the heart of information analysis. It affords a quantitative degree of the power and path of the connection among variables. When we speak about correlation, we are basically looking to solve the question:” How do changes in one variable relate to adjustments in some other”
\n\n***-Definition of Correlation
***\nCorrelation is frequently represented by way of a correlation coefficient, a numerical value that quantifies the degree of association between two variables. There are numerous varieties of correlation coefficients, however, two of the most typically used ones are:
\n**1. Pearson Correlation Coefficient (r):
**\n This is the maximum broadly diagnosed correlation coefficient. It measures linear dating among non-stop variables. The Pearson coefficient ranges from -1 to 1, wherein -1 indicates a super poor linear relationship, 1 suggests an excellent wonderful linear dating, and zero suggests no linear relationship.
\n**2. Spearman Rank Correlation (ρ or rho):
**\nUnlike Pearson, Spearman rank correlation doesn't assume a linear relationship. Instead, it measures the power and course of monotonic institutions between variables. Monotonic method that as one variable will increase, the other either always increases or decreases. The Spearman rank correlation coefficient additionally levels from -1 to at least one.
\n\n\n***-How to Calculate Correlation
***\nCalculating correlation includes numerous mathematical steps, however, with the assistance of software programs and calculators, it's an honest manner. For the Pearson correlation coefficient, the method is:\nWhereas, calculating the Spearman rank correlation involves ranking the statistics after which making use of a one-of-a-kind method.
\n\n***-Interpretation of Correlation Values**
*\nThe correlation coefficient affords treasured insights into the relationship among variables:\nAn advantageous correlation (r > 0) indicates that as one variable increases, the alternative tends to increase as nicely.\nA bad correlation (r < 0) shows that as one variable increases, the opposite tends to decrease.\nA correlation of 0 means that there may be no linear dating between the variables.
\n\n***-Strengths and Limitations of Correlation**
*\n**Strengths:**
\nProvides a clean degree of energy and direction for a relationship.\nEasy to interpret, with values ranging from -1 to at least one.\nWidely utilized in various fields, together with economics, psychology, and biology.
\n**Limitations:**
\nOnly captures linear relationships. Non-linear institutions may fit undetected.\nVulnerable to outliers, that can distort the correlation coefficient.\nCannot infer causation; correlation does not mean causation.
\n\n***-Real-world examples of Correlation***
\nTo illustrate the concept, we'll explore actual-world examples in which correlation plays a pivotal role, from the relationship between schooling and earnings to the effect of advertising on sales.
\n\n***-Visual Representation of Correlation Using Scatterplots***
\nVisualizing records through scatter plots is a powerful way to understand the correlation between two variables. We'll discover how scatterplots can help us visualize the power and direction of correlation in numerous eventualities.\nNow that we've delved into the basics of correlation, let's pass ahead to explore its counterpart, covariance, in the subsequent chapter.\n\n\n## **Covariance**\n\nWhile correlation quantifies the electricity and route of the connection among two variables, covariance is another crucial statistical idea that helps us recognize how variables exchange together. Covariance is in particular essential in records evaluation because it bureaucracy is the muse upon which correlation is built.\n\n***- Definition of Covariance***
\nAt its core, covariance measures how a good deal of two variables alternate collectively. If variables generally tend to grow or lower in tandem, their covariance may be advantageous, indicating a nice dating. Conversely, if one variable tends to increase when the alternative decreases, the covariance can be negative, suggesting poor dating.\n\n***-How to Calculate Covariance***
\nCalculating covariance includes a truthful method:\n\n\n\n\n***-Interpretation of Covariance Values***
\nAn effective covariance indicates that as one variable will increase, the opposite has a tendency to increase as well.\nA negative covariance shows that as one variable increases, the opposite tends to lower.\nA covariance of zero manner that there may be no linear courting among the variables.\nWhile covariance offers statistics approximately the path of the relationship, it lacks the standardized scale of correlation, making it tough to compare covariance values throughout one-of-a-kind datasets.\n\n***-Differences between Covariance and Correlation***
\nAlthough covariance and correlation both measure relationships between variables, they have a few key differences:\nCovariance is not standardized and may take any price, whereas correlation is standardized, ranging from -1 to one.\nCovariance doesn't offer a clear indication of the power of the relationship, not like correlation.\nCorrelation is extra interpretable and broadly used in exercise due to its standardized scale.\n\n***-Strengths and Limitations of Covariance***
\n**Strengths:**
\nCaptures the path of the relationship among variables.\nUseful for figuring out ability relationships for additional investigation.\nAn essential concept in data and information evaluation.
\n**Limitations:
**\nLack of standardization makes it tough to examine covariances throughout one-of-a-kind datasets.\nCannot offer insights into the electricity of the relationship.\nVulnerable to outliers, which could heavily influence covariance values.\n\n***-Real-World Examples of Covariance***
\nWe'll explore practical situations wherein covariance is used to evaluate relationships, together with the relationship among the charges of shares in a portfolio.\n\n***-Visual Representation of Covariance Using Scatterplots***
\n\n\nWhile covariance would not have a standardized visual representation like correlation, we can nevertheless visually explore the relationship between variables with the use of scatter plots and examine how they change together.\nNow that we've blanketed the fundamentals of covariance, we will continue to the following phase, wherein we'll delve deeper into the important differences between correlation and covariance, assisting you're making knowledgeable choices approximately which measure to apply in distinct situations.\n\n## **Key Differences Between Correlation and Covariance**\nIn the previous chapters, we've explored the individual concepts of correlation and covariance, each offering unique insights into the relationship between variables. Now, let's take a closer look at the critical distinctions that set these two measures apart.\n\n*-**Mathematical Differences***
\n**1.Scale:
**\nPerhaps the maximum obvious distinction lies within the scale of the 2 measures. Correlation always tiers among -1 and 1, where -1 indicates a super poor linear courting, 1 shows an ideal nice linear dating, and zero implies no linear courting. In assessment, covariance has no fixed scale and may take any actual cost, making comparisons among covariances throughout different datasets though.
\n***2. Standardization:***
\nCorrelation is standardized, which means it isn't affected by changes in the devices of measurement of the variables. Covariance, however, relies upon the devices of a dimension of the variables, making it sensitive to changes in scale.\n\n***-Interpretational Differences***
\n**1.Direction:**
\nCorrelation explicitly shows the course of the connection among variables. A high-quality correlation indicates that as one variable increases, the opposite has a tendency to grow, whilst a poor correlation means that as one variable increases, the alternative has a tendency to decrease. Covariance, at the same time as presenting statistics approximately the route, does not offer as clear an interpretation.
\n**2. Strength:
**\nCorrelation gives a clear measure of the power of the linear courting between variables. A correlation coefficient close to -1 or 1 shows a strong linear dating, while a coefficient close to zero indicates a susceptible or no linear relationship. Covariance lacks this standardized measure of power.\n\n*-**Scale Differences***
\n**1. Correlation as a Standardized Measure:
**\nCorrelation is constantly expressed as a fee among -1 and 1, no matter the authentic devices of the variables. This standardization permits for clean comparison among extraordinary datasets and variables.\n**2. Covariance's Unit Dependence:**
\nCovariance is heavily promoted via the devices in which the variables are measured. If the variables are in one-of-a-kind devices or have drastically different scales, the covariance fee may be disproportionately affected.\n\n***-Use Cases and Scenarios Where Each Is More Appropriate***
\n**1. Correlation:**
Correlation is satisfactory and suitable when you need to measure and communicate the energy and path of a linear relationship among two continuous variables. It is typically utilized in fields that include finance, social sciences, and epidemiology to evaluate how variables like stock fees, training stages, or disorder charges are associated.\n\n**2. Covariance:**
Covariance is used extra as a raw measure of affiliation, regularly as a stepping stone for calculating correlation. While it may assist in identifying potential relationships, its lack of standardization makes it less interpretable and much less suitable for evaluating relationships across specific datasets.
\nUnderstanding these key differences is vital for selecting the proper degree to investigate and interpret relationships between variables efficiently. In the following section, we are able to delve into practical scenarios and hints for finding out whether to use correlation or covariance in your information analysis endeavours.\n\n***-When to Use Correlation or Covariance***
\nKnowing when to use correlation or covariance is important for effective facts evaluation. While both measures seize relationships among variables, their programs differ drastically. Use correlation when you need to evaluate linear relationships and speak the electricity and path of the affiliation, making it appropriate for fields like finance and psychology. On the opposite hand, appoint covariance when you're exploring relationships in an initial exploration or coping with discrete records, where it serves as a treasured starting point for further evaluation in fields inclusive of biology or environmental technology. Understanding the character of your data and the goals of your evaluation will guide you in deciding on among those effective statistical tools.\n\n\n**-Misconceptions and Common Pitfalls**
\nIn the sector of facts analysis, correlation and covariance may be effective allies, but they can also be resources for misinterpretation and fallacies. It's imperative to dispel some common misconceptions:\n\n**1. Correlation Implies Causation:**
\nThe oft-repeated fallacy that correlation equates to causation is an essential false impression. Just due to the fact variables are correlated does no longer suggest one reason the opposite. Confounding elements and coincidences can mislead, emphasizing the need for rigorous causality investigations.\n\n**2. Over Reliance on Correlation/Covariance:**
\nAnother pitfall is an overreliance on these measures without considering other variables or ability nonlinear relationships. A holistic analysis needs to encompass more than one element and be cautious of simplifying complex interactions.\n\n**-3. Interchangeability of Correlation and Covariance:**
\nTreating correlation and covariance as interchangeable is a commonplace error. While they have percentage similarities, their essential differences in scale and interpretation lead them to be acceptable for wonderful analytical functions. Understanding those distinctions is essential to keep away from misjudging relationships in statistics.\n\n**-Practical Applications**
\nCorrelation and covariance discover applications in numerous fields, consisting of finance, economics, healthcare, and gadget learning:\n\n1. Finance: Correlation and covariance are used in portfolio control to recognize how exclusive belongings circulate on the subject of every difference. A portfolio with belongings that have low or bad correlations can be less unstable.
\n2. Economics: Economists use those measures to research the relationships between financial variables, together with the correlation between hobby fees and inflation.
\n3. Healthcare: In clinical research, correlation and covariance help become aware of relationships between hazard factors and illnesses, helping with the improvement of preventive measures.
\n4. Machine Learning: Feature selection and dimensionality reduction techniques frequently rely on correlations to become aware of applicable functions. Covariance matrices are utilized in Principal Component Analysis (PCA) to transform information into uncorrelated variables.\n\n\n\n***-Conclusion***\n\nIn summary, correlation and covariance are vital statistical concepts with awesome traits and applications. While correlation offers a standardized degree of the linear relationship between variables, covariance gives insights into the joint variability of these variables. Understanding the variations and suitable use of those measures is essential for making informed choices and drawing significant insights from information in diverse fields. Whether you're an economist, records scientist, or investor, getting to know those principles is fundamental for sturdy records analysis and modelling.\n\n\n\n\n\n\n\n\n\n\n\n\n\n\n \n\n\n\n\n\n\n\n\n\n\n\n","blog_slug":"Correlation-Covariance-difference","published_date":"June 21"}]},{"name_and_surname":"Ankush S ","short_description":"Ankush is a passionate data analyst, delving into the world of numbers and insights. Currently, his focus lies in Natural Language Processing (NLP), where he explores the power of Language Models (LMs). Transforming raw data into meaningful narratives is not just a profession but a fascinating journey that he embarks upon every day","twitter_url":"https://www.linkedin.com/in/ankush-s-97a89b290?utm_source=share&utm_campaign=share_via&utm_content=profile&utm_medium=android_app","linkedin_url":"https://www.linkedin.com/in/ankush-s-97a89b290?utm_source=share&utm_campaign=share_via&utm_content=profile&utm_medium=android_app","designation":"Designation","image":{"localFile":{"childImageSharp":{"gatsbyImageData":{"layout":"constrained","backgroundColor":"#e8e8e8","images":{"fallback":{"src":"/static/2a736b398fbee81cf7e67d5b3eeafff3/0f014/Whats_App_Image_2023_12_16_at_5_57_10_PM_1907380ec2.jpg","srcSet":"/static/2a736b398fbee81cf7e67d5b3eeafff3/067e2/Whats_App_Image_2023_12_16_at_5_57_10_PM_1907380ec2.jpg 305w,\n/static/2a736b398fbee81cf7e67d5b3eeafff3/6688d/Whats_App_Image_2023_12_16_at_5_57_10_PM_1907380ec2.jpg 610w,\n/static/2a736b398fbee81cf7e67d5b3eeafff3/0f014/Whats_App_Image_2023_12_16_at_5_57_10_PM_1907380ec2.jpg 1220w","sizes":"(min-width: 1220px) 1220px, 100vw"},"sources":[{"srcSet":"/static/2a736b398fbee81cf7e67d5b3eeafff3/1f91c/Whats_App_Image_2023_12_16_at_5_57_10_PM_1907380ec2.webp 305w,\n/static/2a736b398fbee81cf7e67d5b3eeafff3/54113/Whats_App_Image_2023_12_16_at_5_57_10_PM_1907380ec2.webp 610w,\n/static/2a736b398fbee81cf7e67d5b3eeafff3/6ddc1/Whats_App_Image_2023_12_16_at_5_57_10_PM_1907380ec2.webp 1220w","type":"image/webp","sizes":"(min-width: 1220px) 1220px, 100vw"}]},"width":1220,"height":894}}}},"blogs":[{"title":"TEXT ANALYTICS","Descrption":"According to renowned entrepreneurial strategist Paul Brien, visionary decision-making happens at the intersection of intuition and logic. Now the question arises as to why visionary decisions are necessary. For the successful running of any business, entity, or organization there must be some people who make visionary decisions. Now when does the intersection of intuition and logic happen? suppose the decision-makers can correctly predict their upcoming activities or people’s sentiments, and in market scenarios, they can make decisions accordingly. so in these circumstances, the complete analysis of the data is crucial. so, today's topic Text Analytics is one of the data analysis processes that is quite effective and powerful in getting insights from unstructured textual data.\n\n**INTRODUCTION TO TEXT ANALYTICS
**\n*DEFINITION*
\nThe process of deriving valuable information and insights from the available textual data. Which in turn helps in enhancing data analysis with textual information\n\n**RISE OF TEXT ANALYTICS
**\nThere is a vast amount of unstructured data available from various sources like social media, customer reviews, emails, and more which aids decision-makers in making informed decisions, enabling companies to enhance products and services for better customer satisfaction, assessing risks by analysing reports, and preventing of any fraudulent activities.\n\n\n**KEY BENEFITS OF TEXT ANALYTICS ARE AS FOLLOWS**
\n1. Sentiment analysis
\n2. Trend analysis
\n3. customer feedback analysis
\n4. Insights for market research
\n5. Risk assessment and fraud detection
\n6. Healthcare benefits etc
\n\n### **INDUSTRY RELEVANCE OF TEXT ANALYTICS
**\n\n\n**SOCIAL MEDIA**
\nIn today’s world as technology improves it is easily available to the last person in society which has given rise to many social media apps like Twitter, Facebook, Instagram, LinkedIn, etc. Hence there will be a huge generation of data and one prominent use is sentiment analysis using Natural Language Processing (NLP) techniques which will help in measuring public opinions, attitudes, and emotions.\n\nMany businesses get insights from customers' feedback across social media platforms, analyzing comments, reviews, and mentions helps in customer preference likes and dislikes which helps in marketing strategies and customer service.\nBy monitoring sensitive topics, potential legal issues, and inappropriate content we can mitigate risks like mob lynching, protests, and riots which are challenging to law and order situations. so, it helps the government also to maintain peace and harmony in the state.\n\n**HEALTHCARE**
\nText analytics plays a crucial role in the healthcare industry. It even increased especially after the COVID-19 pandemic across the world, due to the abundance of textual data generated from patient records, clinical notes, and research papers we can see some key benefits.\nAnalyzing patients’ records helps healthcare professionals in treatment planning, aiding diagnosis, and finding patterns, and potential risks to the health of people.\nAnalyzing research papers, and clinical trial data through text analytics expedites the process of identifying drugs, how these drugs interact with the human body, etc, and in turn discovering new treatments.\nImproving the administrative process by analyzing feedback, and patients’ surveys to improve service quality, efficiency, and patient satisfaction.\n\n**FINANCE
**\nAs the major businesses, companies, and global economies are more concerned with the fluctuation of the trends in the market, fraud, investments, and text analytics come in handy to tackle some of the following concerns.\nAnalyzing news articles, social media, and financial reports helps investors to know market sentiment and make informed investment decisions.\nAnalyzing textual data helps in spotting irregularities or fraudulent activities by detecting patterns that might indicate fraudulent behavior.\nAlgorithmic trading is quite evolving in the finance sector which provides for quantitative models aiding in algorithmic trading strategies based on sentiment analysis and news sentiment.\nAbove are a few mentioned key applications of text analytics across various industries. Which varies from trend monitoring to fraud monitoring. \n\n\n### **TEXT ANALYTICS TOOLS AND TECHNIQUES**
\n\n**TEXT PROCESSING
**\nText preprocessing is a crucial step in text analytics to transform unstructured text data into a formal suitable for analysis has the following procedure
\n**TOKENIZATION:
**\nThis involves the breaking down of text into smaller units such as words or phrases which enables analysis by getting a structured format.
\nE.g.: Converting sentences into individual words or phrases
\n**STOP WORDS REMOVAL:
**\nThis involves eliminating common words like (the, and, is, an, etc) which have no significant meaning for analysis so that it improves the accuracy of analysis.
\n**LEMMATIZATION AND STEMMING:
**\nThis involves reducing words to their base or root form to normalize variants.\nE.g.: eating, ate to eat\n\n\n### **TEXT CLASSIFICATION
**\n\n**SUPERVISED LEARNING FOR TEXT:**
\nAlgorithms learn from labeled data to accurately categorize text into specific groups, aiding tasks like sentiment analysis, spam detection, etc.\nE.g.: support vector machines (SVM), Naive Bayes, recurrent neural networks (RNNs)\n\n**TOPIC MODELLING:**
\nFrom a large amount of textual data using statistical methods, we will find hidden themes from text by looking at recurring patterns and topics which in turn are used for the content organizations and recommendations.\nNAMED ENTITY RECOGNITION (NER):\nIn this, we will identify and categorize the entities from the textual data into names, places, and dates which is helpful in chatbots and search engines.\nIn this way, we can classify text into different themes using some of these techniques.\n\n\n### **TEXT VISUALIZATION
**\nThis provides us the textual insights in a visual format\n\n**WORD CLOUDS:**
\nIt provides the word frequency based on their occurrence within the text, provides us with the most prevalent terms, and gives us valid insights into key themes.\n\n**HEATMAPS:
**\nUsing color-coded visuals, heatmaps illustrate trends and patterns in textual data and showcase variations in word frequency and sentiment across texts enabling easy identification of trends within the data.\nNETWORK ANALYSIS:\nIn this we will map connections and relationships within text data, by this it helps to uncover associations between words, topics, or entities revealing relationships among them. \n\n\n### **CHALLENGES AND CONSIDERATIONS IN TEXT ANALYTICS
**\n\nEven though there are so many benefits and applications of text analytics as we saw above it comes with certain challenges also, As time passes with advanced technological tools we may overcome these also.\nSome of the challenges are:
\n1. Overcoming bias in language models and datasets.
\n2. Ensuring privacy and confidentiality in text analytics.
\n3. Ethical implications of automated text analytics.
\n4. Dealing with unstructured text data.
\n5. Handling multilingual text.
\n6. Handling large amounts of textual data.
\n7. Real-time text analytics.
\n\n\n## **CONCLUSION
**\nIn essence, text analytics can be a transformative tool for unlocking invaluable insights from the vast ocean of unstructured data. By harnessing the power of Natural Language Processing (NLP) and machine learning, businesses can gain a competitive edge, make data-driven decisions, and enhance customer experiences. Text analytics will be part of the new era of data-driven intelligence and strategic decision-making.\n","blog_slug":"text-analytics","published_date":"Dec 16"},{"title":"Unveiling the Magic of Data Mining: From Predictive Prowess to Ethical Enchantment","Descrption":"In the vast expanse of the digital universe, there exists a captivating realm where raw data transforms into meaningful insights. This enchanting process is none other than data mining, a wizardry that not only deciphers the complexities of information but also shapes the way we experience the digital age.\n\n###** The Ocean of Information**\n\nImagine the internet as a boundless ocean teeming with data, from social media interactions to online shopping preferences. Data mining emerges as the mystical net, skilfully cast to extract valuable pearls of wisdom from this vast sea of information. It's akin to a seasoned detective meticulously sifting through clues to unravel a compelling mystery.\n\n### **Patterns:**\n\n The Hidden Tapestry One of the most mesmerizing facets of data mining lies in its ability to discern patterns. Consider your online shopping escapades – the moment the platform suggests the perfect pair of shoes that align with your taste. Data mining, in this scenario, acts as a clairvoyant companion, recognizing patterns in your past choices to predict what might capture your interest next. It's like having a perceptive friend who just gets you!\n\n\n## **Applications Across Industries**\n\nData mining extends its prowess beyond personal preferences, becoming a superhero tool in various fields. In healthcare, it serves as a diagnostic ally, predicting diseases and tailoring treatments based on individual health data. In finance, it operates as a financial oracle, analysing market trends to inform strategic investment decisions. The versatility of data mining makes it an indispensable force across industries, weaving its magic in diverse arenas.\n\n#### **Demystifying the Jargon: Algorithms and Clusters**\n\nLet's demystify the jargon. Algorithms are the secret recipes that data miners follow to uncover patterns within the data. Picture them as well-crafted spells designed to reveal hidden insights. Clusters, on the other hand, are akin to the shelves in a supermarket, grouping similar items together for easier understanding.\n\n#### **Ethical Considerations: The Responsible Wizard**\n\nEvery enchanting tale comes with a responsibility, and data mining is no exception. While it weaves its magic, there's an ethical compass that must guide its use. Think of it as wielding magic responsibly. Privacy and fairness are paramount, ensuring that the data magic respects the boundaries of ethical practice.\n\n#### **Peering into the Crystal Ball: Future Trends in Data Magic**\n\nThe story of data mining is an ever-evolving saga. Envision a future where it evolves into an even more sophisticated art, delving into complex problem-solving and simplifying our lives further. It's like progressing from a basic spell to a powerful enchantment, with the promise of a more magical digital realm.\n\n\nIn summary, data mining is the enchanting wand that transmutes raw data into gold, crafting a personalized, efficient, and, dare we say, magical digital world. It's not just about numbers; it's about infusing our lives with a touch of enchantment. So, the next time your favourite app suggests something you adore, tip your hat to the wizards of data mining working diligently behind the scenes. They are the unsung heroes making our digital lives a bit more enchanting with every algorithm and cluster they conjure.\n\n","blog_slug":"unveiling-the-magic-of-data-mining-from-predictive-prowess-to-ethical-enchantment","published_date":"Feb 17"}]},{"name_and_surname":"Neeta S Karadi","short_description":"Neeta is passionate about data analytics and eager to dive deeper into the world of machine learning. Python's simplicity captivates her, making it the perfect language for her interests. She's thrilled to embark on diverse projects and explore applications within these dynamic fields.","twitter_url":"https://www.linkedin.com/in/neeta-karadi-67558425b?utm_source=share&utm_campaign=share_via&utm_content=profile&utm_medium=android_app","linkedin_url":"https://www.linkedin.com/in/neeta-karadi-67558425b?utm_source=share&utm_campaign=share_via&utm_content=profile&utm_medium=android_app","designation":"Data Analyst Intern","image":{"localFile":{"childImageSharp":{"gatsbyImageData":{"layout":"constrained","backgroundColor":"#c8c8c8","images":{"fallback":{"src":"/static/e7c6643a8503219ae0b9acd22f231e0c/715cd/pic_27400ad8d4.jpg","srcSet":"/static/e7c6643a8503219ae0b9acd22f231e0c/7fc76/pic_27400ad8d4.jpg 244w,\n/static/e7c6643a8503219ae0b9acd22f231e0c/2dc02/pic_27400ad8d4.jpg 488w,\n/static/e7c6643a8503219ae0b9acd22f231e0c/715cd/pic_27400ad8d4.jpg 975w","sizes":"(min-width: 975px) 975px, 100vw"},"sources":[{"srcSet":"/static/e7c6643a8503219ae0b9acd22f231e0c/09339/pic_27400ad8d4.webp 244w,\n/static/e7c6643a8503219ae0b9acd22f231e0c/033d4/pic_27400ad8d4.webp 488w,\n/static/e7c6643a8503219ae0b9acd22f231e0c/b2eb8/pic_27400ad8d4.webp 975w","type":"image/webp","sizes":"(min-width: 975px) 975px, 100vw"}]},"width":975,"height":1163}}}},"blogs":[{"title":"WHY FUNCTIONS ARE IMPORTANT IN PYTHON PROGRAMMING LANGUAGE?","Descrption":"Let us start with a real-life example,
\nImagine you are building a fence. You need to know how much wood is needed to build it. Now you can not just sit and calculate the area and use math. Instead, you can use functions that take the width and height as inputs and calculate the total area. This avoids errors and saves you time.\n\n## **Functions**
\nIn my own words, a function is a reusable block of code that performs a specific task or set of tasks that only returns when it is called. If there is a certain code that has to be written again and again for different inputs, we make use of functions.\n\n**SYNTAX:**
\n\n\nWe use def keyword to define the function, followed by the function name.\nIn parenthesis, we pass the parameters/arguments.\nThe function block starts with a colon \" : \" and there should be an indentation while writing the block statements.\nWe use return statement to return the function value. There should be only one return statement in the function.\n\n\n### - **Advantages of Using Functions**
\n- It is easy to read and understand.
\n- We can reuse the code multiple times.
\n- It is easier to organize the code.
\n- Complex code can be broken into simpler code.\n\n### - **Types of Functions**
\nThere are two types of functions:
\n**1. Built-in functions
**\nThese functions are already precoded in Python, we can directly use those functions.\nEg: print(), len(), max(), type(), etc.\n\n**2. **User-defined functions:
****\nUser-defined function means the user will define those functions as per user need.\n\n\n### **- Creating a Function**
\nNow using the def keyword let's create a function.\n\n\nHere we have ‘fun’ as our function name followed by parenthesis. Then we have the print statement.\n\n### **- Calling a function
**\nAfter creating a function, we should call it by using the name of the function followed by a parenthesis that contains the parameters of that particular function.\n\n\n\nAs we can see in the above example we have to call the function i.e. fun(), and now it will execute the print statement.\n\n\n### **- Function with Parameters**
\n\n\n\nHere we have defined the function sum(a,b), it takes parameters a & b, calculates their sum, and prints the result.\nThen we call the function sum(10,20) these values are passed as arguments in the function. The function performs the addition and prints the final result.\n\n#### ***Examples:*
**\n**-** A simple Python function to check whether x is even or odd.\n\n\nIn the above program, we have used conditional statements to check whether the given number is even or odd.\n\n**-** Finding a maximum of two numbers.\n\n\n\nLet’s write a program on the real-life example we took before:\nCalculating the area of a rectangle:\n\n\n\nThe function total_area takes width and height as inputs and returns the calculated area. Now we will give the actual measurement values to the width and height that is required for the fence.\nThen we call the function total_area followed by the width and height that is provided. This reduces time and math errors.\n\n\n### **-** Function Arguments in Python\nArguments are specified after the function name inside the parentheses. We can add as many arguments as we want but they should be separated with a comma.\n\n\n### **-** **Types of Arguments
**\n1. Positional Argument\n2. Keyword Argument\n3. Default Argument\n4. Variable-Length Argument\n\n\n- **Positional Arguments:
**\nThese are arguments that need to be included in a proper position or order. The first positional argument needs to be listed first when the function is called and so on.\n\n\n\n- **Keyword Arguments:
**\nThey are related to function calls. When the keyword arguments are used in a function call, the caller identifies the arguments by the name of the parameter.\n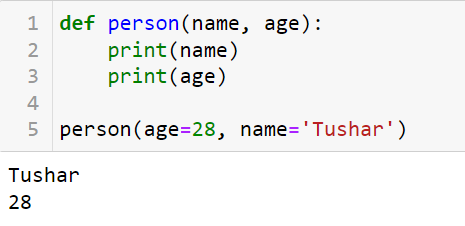\n\n\n* **Default Arguments:
**\nIt is an argument that assumes a default value if a value is not provided in the function call for that argument.\n\n\n\nIn the below case, if we pass a value in the function call, it will override the default value.\n\n\n\n### **-** **Variable-length Arguments:
**\nThese are also known as varargs that allow a function to accept several arguments.
\nThere are two ways to define these arguments in a function.
\n1. args
\n2. kwargs\n\n\n* **args:**
\nThe asterisk() before the parameter name allows the function to accept any number of positional arguments. The arguments passed to ***args** are collected into a tuple within the function.\n\n\n\nIn the above example, in the function **add(n1, *n2)**, n1 takes one argument and the arbitrary number of additional arguments is grouped into a tuple called n2. n2 calculates all the values that are passed after n1.
\n1. **sum=0** means initializing the variable **sum** to ‘0’.\n2. **for i in n2** means looping through each element in the iterable **n2**.\n3. **sum+=1** here it adds the current element ‘i’ to the variable **sum**.\n\nThen we call the function add() with n1 as 5 and multiple values 10,20,30,40,50 are passed as additional arguments. The function calculates the sum of all the values present in n2 (which is 10,20,30,40,50) and then adds to n1.\n\n* **kwargs:**
\nThe double asterisk() before the parameter name, allows the function to accept any number of keyword arguments. The arguments passed to ** **kwargs** are collected into a dictionary within the function.\n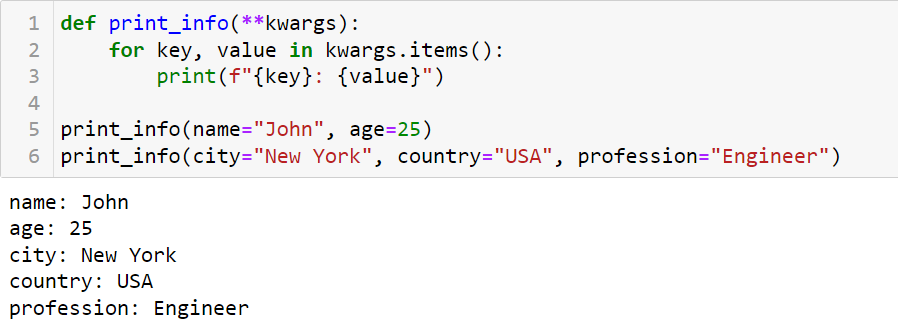\n\n\nIn the above example, we have defined a function called \n **print_info**(** **kwargs)** using ****kwargs
**\n\n- ** **kwargs:** this syntax is used to define a function that allows to passing of any number of keyword arguments and these arguments are collected in the form of a dictionary named **kwargs.**
\n- **for key, value in kwargs. items():** this loop iterates through key-value pairs in the dictionary **‘kwargs’** and prints each pair.
\n- As we can see the function print_info() is called twice.\n\n1. **print_info(name=\"John\", age=25):** in this function, we have passed two keyword arguments i.e. name and age. So, it prints:\n\n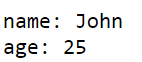\n\n\n\n3. **print_info(city=\"New York\", country=\"USA\", profession=\"Engineer\"):** In this function we have passed three arguments i.e. **city, country, and profession.** So, it prints:\n\n\nWe use this type of function when we want to handle unknown named arguments and process them as a collection of key-value pairs.\n\n\n### **- Recursive Function**\nA recursive function is a function which calls itself. The recursive term can be defined as the process of defining something in terms of itself.\nA recursive function needs to have a condition to stop calling itself so we use an ‘if’ statement.\n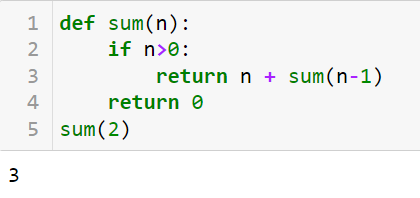\n\nIn the above example, we can see that the function sum(n) is a recursive function that calculates the sum of all positive numbers starting from 1.\n\n* Inside the function:
\n1. **if n > 0:** This is a conditional statement that says if **n** is greater than **0** then proceed with the calculation.
\n2.**return n + sum(n-1)** this line is a recursive call to the **sum()** function. It adds the current values of **n** to the sum of all positive integers less than **n** i.e. **n-1.**\n3. It keeps reducing **n** by**1** each time until **n** becomes **0.**
\n#### *For example:*\n\nSo, here when we call sum(2), it recursively adds 2+1+0, resulting in the return value of 3.\n\n\n\n### **-Anonymous Function**\nA function without a name is known as an anonymous function. It is not defined using the def keyword instead we use the lambda keyword.\n\n* **Syntax**\n\n\nlambda keyword is used to create a lambda function\n
\n1.**f=lambda x:x+x:** here, a lambda function is created and assigned to a variable **f.** Then lambda function takes an argument as **x** and returns the result of **x+x.**
\n2. **f(5):** this line calls the lambda function **f** with the argument **5** When argument **5** is passed it substitutes **x** and the function evaluates **5+5** resulting in **10.**\n\n\n\n## **CONCLUSION**\nIn this blog, we have learned why functions are important in the Python programming language. We learned about the advantages and disadvantages of functions, types of functions that are built-in functions, and user-defined functions. We saw how to create and call a function with an example, and then we learned about function arguments and types of arguments with examples of each. Lastly, we have seen other types of functions such as recursive functions and anonymous functions with examples of each. \n\n \n\n\n","blog_slug":"functions-important-in-python","published_date":"Dec 27th"}]},{"name_and_surname":"Mahesh S","short_description":"Digital Market Analyst","twitter_url":null,"linkedin_url":null,"designation":"Designation","image":null,"blogs":[{"title":"Unlocking Success: The Power of Digital Marketing for Startups in India","Descrption":"## **Introduction**\n\nNowadays, starting a business in India comes with a ton of opportunities, especially for startups. According to the Economic Survey 2022, there's been a surge, with 61,400 Gluno startups recognized by the department for the promotion of industry and internal trade. That's impressive, right? The support they receive is comprehensive – from taxes and loans to investment, human resources, and technology. With India now boasting the world's 3rd largest economy, it's a great time for anyone diving into the world of entrepreneurship. So, if you're one of those daring souls starting a new venture, best of luck!\n\n### **Transition to Digital Marketing**\nAlright, let's shift gears and dive into the world of digital marketing.
\n**Why?**
\nBecause it's a game-changer for startups. In an era where digital marketing is taking over, even poets are writing about it! Here's a little verse for you:\n\nIn the digital symphony, marketing plays,\nDexterity melody in countless ways.\nEvery post is a note in the startup song,\nDevising connections that grow strong.
\n\n### **Digital Marketing Prep**
\nBefore you set sail in the digital marketing ocean, there are a few key things to prep. Answer these questions:\n\n1. Who is my target market?\n2. What message do I want to convey?\n3. Which media will I use to reach my audience?\n4. How will I capture leads?\n5. What's my lead nurturing strategy?\n6. How will I convert leads to sales?\n7. What's my plan for a top-notch customer experience?\n8. How do I increase customer lifetime value?\n9. How do I stimulate referrals?\n\nOnce you have clarity on these points, you're ready to ride the digital marketing wave.\n\n\n## **Advantages of Digital Marketing for Startups**\n\n**-Cost-effective Customer Research**
\nEven if startups don't have the customer base of established brands, digital marketing tools offer them insights. It's like a cheat code to understand what works and what doesn't, helping avoid resource-wasting marketing campaigns.\n\n**-Engaging with Customers**
\nEngaging is the name of the game. Digital marketing provides platforms for startups to connect personally with customers. This connection is gold – understanding your product's strengths and weaknesses allows quick adjustments for a better customer experience.\n\n**-Real-time Metrics for Success**
\nDigital marketing serves up real-time metrics. You get to see what's working and what needs tweaking. It's like having a dashboard for your success journey.\n\n**-Market at Your Fingertips**
\nWith digital marketing tools like social media, email, websites, and YouTube, startups can market their products globally from the comfort of their homes.\n\n**-Quality and Quantity Rule**
\nIn the digital marketing world, quality and quantity matter. If your content is top-notch, it gets shared. Content is your ace – it can make or break your digital marketing game.\n**Closing Thoughts**
\nSo, there you have it – the perks of digital marketing for startups. From cost-effective research to engaging with customers, it's a game-changer. Remember, digital marketing is like an ocean. Whether you catch normal fish or the goldfish is up to you. And one more thing, it's not just about informing; it's about taking that information, correcting course, and steering toward success.","blog_slug":"digital-marketing-for-startups-in-india","published_date":"Dec 28"}]},{"name_and_surname":"Prithvi S","short_description":"Prithvi is a Business Analyst with Analogica Software development PVT LTD. She also Mentors Young Business Analysts with Certisured . She is highly passionate about Data-driven marketing with Business Intelligence tools. ","twitter_url":"https://www.linkedin.com/in/prithvi-s-a79a961b1/","linkedin_url":"https://www.linkedin.com/in/prithvi-s-a79a961b1/","designation":"Business Analyst","image":{"localFile":{"childImageSharp":{"gatsbyImageData":{"layout":"constrained","backgroundColor":"#d8e8f8","images":{"fallback":{"src":"/static/8a78ada14d1e0825dd19eae6607b9701/f6a41/Whats_App_Image_2024_03_28_at_12_17_13_PM_62eb968744.jpg","srcSet":"/static/8a78ada14d1e0825dd19eae6607b9701/4c6e9/Whats_App_Image_2024_03_28_at_12_17_13_PM_62eb968744.jpg 101w,\n/static/8a78ada14d1e0825dd19eae6607b9701/5fe6c/Whats_App_Image_2024_03_28_at_12_17_13_PM_62eb968744.jpg 203w,\n/static/8a78ada14d1e0825dd19eae6607b9701/f6a41/Whats_App_Image_2024_03_28_at_12_17_13_PM_62eb968744.jpg 405w","sizes":"(min-width: 405px) 405px, 100vw"},"sources":[{"srcSet":"/static/8a78ada14d1e0825dd19eae6607b9701/f472d/Whats_App_Image_2024_03_28_at_12_17_13_PM_62eb968744.webp 101w,\n/static/8a78ada14d1e0825dd19eae6607b9701/d739c/Whats_App_Image_2024_03_28_at_12_17_13_PM_62eb968744.webp 203w,\n/static/8a78ada14d1e0825dd19eae6607b9701/829e2/Whats_App_Image_2024_03_28_at_12_17_13_PM_62eb968744.webp 405w","type":"image/webp","sizes":"(min-width: 405px) 405px, 100vw"}]},"width":405,"height":432}}}},"blogs":[{"title":"Unleashing the Power of Business Intelligence: A Comprehensive Guide","Descrption":"\n\n## **Introduction**\nIn today’s fast-paced, hyper-competitive business world, one thing is abundantly clear: **data is power** ,but only if used wisely. Modern organizations sit atop vast mountains of raw information. Without the right tools and processes, that data remains just numbers and noise. This is where **Business Intelligence** steps in.\n\nBI is more than just dashboards and reports. It’s a comprehensive ecosystem that transforms scattered data into actionable insights, helping organizations make smarter decisions, optimize performance, and outpace their competitors. \n\nIn this blog, I’ll break down the fundamentals of BI, explore its core components, highlight real-world applications, and share insights from leading companies. Whether you’re a student, intern, or decision-maker, this guide will give you a complete picture of what Business Intelligence can do for you.\n\n\n\n## **What Is Business Intelligence?**\nBusiness Intelligence refers to the technologies, frameworks, and practices used to collect, process, and analyze business data. The goal? To convert raw numbers into meaningful insights that guide decision-making at every level — from marketing and operations to HR and finance.\n\nBI doesn’t just focus on the **“what happened”** — it helps answer **why it happened, what might happen next, and what can be done about it.**\n\n
\n\n## **Core Components of BI**\nTo truly appreciate BI, it's important to understand its building blocks:\n#### **a. Data Warehousing**\nActs as a central repository that consolidates data from different sources - ERPs, CRMs, spreadsheets, APIs into one structured format for analysis.\n#### **b. Data Analytics**\nInvolves applying statistical techniques and data models to discover patterns, spot trends, and make predictions. Tools like Python and SQL are especially powerful in this space.\n#### **c. Reporting & Dashboards**\nTools like Power BI and Tableau turn rows of data into compelling visuals ,bar charts, heatmaps, slicers, and KPIs that enable faster, clearer interpretation.\n#### **d. Data Mining**\nGoes a step deeper to uncover hidden patterns in massive datasets. Think of it as digging through data to find gold , and it’s often used for customer segmentation, fraud detection, and market basket analysis.\n\n \n
\n
\n\n## **Common Challenges and How to Overcome Them**\nLike any transformative effort, BI isn’t without its challenges.\n#### **1. Data Silos and Integration Issues**\nData often exists in fragmented systems. Without proper integration (through ETL pipelines or APIs), analysis becomes skewed or incomplete. Building a unified data architecture is critical.\n#### **2. Security and Compliance**\nWith increased data access comes greater risk. BI teams must work closely with IT and legal to implement role-based access, encryption, and comply with regulations like GDPR.\n#### **3. Change Management**\nSome teams may resist moving from Excel sheets to Power BI dashboards. Overcoming resistance requires clear communication about BI’s value and providing ongoing support during the transition.\n\n
\n\n## **Real-World Examples of BI in Action**\n#### **1. Netflix**\nNetflix uses Business Intelligence and advanced analytics to study viewing habits. By analyzing which shows users binge-watch, pause, or abandon, they make smart decisions about future content investments — increasing engagement and satisfaction.\n#### **2. Amazon**\nBI plays a vital role in Amazon’s inventory management and supply chain optimization. By continuously analyzing data from warehouses, delivery systems, and customer orders, Amazon improves delivery speed while reducing costs.\n#### **3. Spotify**\nSpotify personalizes playlists like “Discover Weekly” by applying BI techniques that track user behavior, audio features, and social sharing. This improves user retention through hyper-personalized experiences.\n\n
\n\n## **Beyond the Basics: The Future of BI**\nBI is no longer just a backend support tool — it’s becoming central to strategic planning. Emerging trends that are redefining BI include:\n- **Artificial Intelligence Integration:**\n Predictive analytics and AI models are increasingly embedded in BI platforms, enabling forecasting and anomaly detection without needing to write code.\n- **Self-Service BI:**\n Tools like Power BI now offer user-friendly interfaces so that even non-technical users can generate their own reports and insights — reducing dependency on IT.\n- **Data Storytelling:**\n Analysts are shifting from static reports to narrative-driven presentations that use visuals and insights to tell compelling stories and influence decisions.\n\n
\n\n## **Conclusion: Making BI a Strategic Priority**\nBusiness Intelligence isn’t just a tool — it’s a mindset. In my own journey as an intern, I’ve witnessed how BI can transform chaos into clarity, turning complex datasets into meaningful narratives that influence action. Whether it was streamlining logistics for a client or predicting customer churn using Python and Power BI, the power of BI lies in its ability to turn insight into impact.\n\nFor organizations, the message is clear: **embracing Business Intelligence isn’t optional — it’s essential.** And for students or early professionals entering this field, now is the perfect time to build your skills, experiment with projects, and be part of this data revolution.\n\n\n\n\n\n","blog_slug":"unleashing-the-power-of-business-intelligence-a-comprehensive-guide","published_date":"May 9th , 2025"},{"title":"Decoding Analytics :The Real Difference between Data Analytics and Business Analytics ","Descrption":"Every second ,businesses across the world collect massive amounts of data, whether its sales numbers, customer feedback or inventory movement. But raw data on its own isn't enough. What makes the difference is how that data is interpreted and used to make best decisions.\n\n\nThis is where analytics step in. More specifically Data Analytics & Business Analytics - two fields that sound quite similar but actually serve very different purposes. Understanding the line between them can help students ,professional, and business leaders navigate today’s data driven world with clarity.\nThis blog explores how each of these domains work, what skills they require , how they compare and most importantly how they shape careers and business success in the real world. \n\n**Data Analytics**
\nData Analytics is essentially the process of making sense of raw data. Analysts in this field work with everything from spreadsheets and databases to advanced statistical software, all with the goal of identifying trends, discovering patterns, or spotting anomalies.\nIt’s not just about creating reports, it’s about answering questions like:
\n- What happened (in our sales last quarter)?\n\n\n- Why did customer sign-ups suddenly drop ?\n\n\n- Can we predict next month’s revenue based on current trends ?
\n\nThere are four main branches of data analytics:
\n1. Descriptive – Summarises what has already happened.\n\n\n2. Diagnostic – Explains why something happened.\n\n\n3. Predictive – Looks at past data to forecast future outcomes.\n\n\n4. Prescriptive – Recommends what actions should be taken.\n\nCommon tools in this field include Python, R, SQL, Excel, and Visualization platforms like Power BI and Tableau. The work is often technical and grounded in statistics or programming.\n\n**Business Analytics**
\nWhile data analytics is about uncovering insights, **Business Analytics (BA)** is about using those insights to support or shape decisions within an organisation. BA focuses more on solving specific business problems—whether it's improving customer service, cutting costs, or increasing profit margins.\nFor instance, a business analyst might:
\n- Examine sales data to optimise product pricing\n\n\n- Review customer retention numbers to adjust marketing strategy\n\n\n- Use past financial performance to guide future budgeting\n\nBusiness analytics tools can include **Excel, Power BI, SQL**and platforms like **SAP**, but unlike data analytics, business analytics leans heavily on **business knowledge**, how departments work, what **KPIs matter**, and how strategies are implemented.\nIn short, where **data analysts** might ask **“what does the data say?”**, **business analysts** follow up with **“so what should we do about it?”**\n\n**Key Differences Between Data Analytics and Business Analytics**
\nThough they often work side by side, the goals and approaches of these two roles differ significantly.\n\n| **Aspects** | **Data Analytics** | **Business Analytics** |\n| ------------------------ | ------------------------------------------------------------------- | --------------------------------------------------------------------------- |\n| **Scope** | Broad application across multiple data-centric functions | Focused on analyzing and enhancing business operations and outcomes |\n| **Primary Objective** | Extract insights, identify trends, and uncover data-driven patterns | Drive strategic and operational decisions based on data interpretation |\n| **Common Tools** | Python, R, SQL, Jupyter Notebook, Tableau, Power BI | Excel, Power BI, SQL, SAP, Salesforce Analytics |\n| **Core Competencies** | Data mining, statistical modeling, programming, data engineering | Business process understanding, domain knowledge, stakeholder communication |\n| **Typical Deliverables** | Predictive models, statistical reports, interactive dashboards | Business recommendations, strategic reports, KPI analyses |\n\nIn practical terms, a data analyst might present findings, while a business analyst explains what those findings mean for the company.\n\n**Where They Overlap ?**
\nIt’s common for both fields to use the same tools, like SQL for querying data or Power BI for visualising results. In fact, many professionals end up wearing both hats, especially in startups or smaller teams.\nThe key overlap lies in the **shared goal:** using data to guide better decisions. Whether you come from a tech or a business background, learning both sides of analytics can be a powerful combination.\n\n**Real-World Applications**
\nAnalytics isn't just a buzzword, it has transformed how entire industries operate.
\n\n**How Data Analytics is Used:**
\n\n**- In social media,** companies monitor conversations across platforms to understand brand perception and improve user experience.\n\n**- In sports** teams analyse player stats to design winning strategies or reduce injury risks.\n\n**- In public health** data models help forecast disease spread and plan responses.\n\n**- In transportation**, predictive analytics guides everything from traffic flow to fuel consumption.\n\n\n**How Business Analytics is Used:**
\n\n**Retailers** analyse customer purchase patterns to plan promotions and stock management.\n\n\n**Banks** use analytics to evaluate creditworthiness or prevent fraud.\n\n\n**Food delivery apps** rely on BA to fine-tune delivery times, customer service, and pricing.\n\n\n**Human Resource teams** analyse employee performance and retention to improve workplace policies.\n\n**Real-life examples include:**
\n\n- Amazon’s supply chain optimisation\n\n\n- Swingy’s dynamic delivery pricing\n\n\n- Zomato’s restaurant recommendation engine\n\n\nEach of these uses some form of business analytics to enhance customer experience and streamline operations.\n\n**Skills Required for Each**\n\n**Both roles demand a curious mindset and an ability to dig into data. But they diverge when it comes to specific skills.**\n\n**Key Skills for Data Analysts:**\n\n- Programming knowledge: Python or R\n\n\n- Data management: SQL, Excel, database handling\n\n\n- Statistical thinking: Confidence intervals, regression, A/B testing\n\n\n- Data cleaning and wrangling\n\n\n- Visualisation tools: Power BI, Tableau, matplotlib\n\n\n**Key Skills for Business Analysts:**
\n\n- Understanding of business functions and metrics\n\n\n- Strong Excel and Power BI skills\n\n\n- SQL for pulling data\n\n\n- Comfort with financial and operational data\n\n\n- Clear communication and storytelling\n\n \nThe difference here is that a **data analyst dives deep into the \"HOW\" of the data**, while a **business analyst focuses on the \"SO WHAT.\"**\n\n**Career Paths, Roles, and Responsibilities**
\nBoth fields are booming and there's no shortage of career options.\n\n**Careers in Data Analytics:**
\n**- Data Analyst** – Organises and interprets raw data, builds dashboards\n\n\n**- Data Scientist** – Uses machine learning and predictive models for future forecasting\n\n\n**- Data Engineer** – Builds systems that collect and process large-scale data\n\n\nCompanies that hire:\n\n- Tech giants like **Google, Microsoft**\n\n\n- E-commerce platforms like **Amazon**\n\n\n- Healthcare firms like **Philips** or **GE**\n\n\n- Governments and research institutions\n\n**Careers in Business Analytics:**
\n\n- Business Analyst – Identifies business needs and translates them into technical solutions\n\n\n- BI Analyst – Develops dashboards and KPIs for executives\n\n\n- Marketing or Product Analyst – Evaluates campaign or product performance\n\n\n**Typical employers include:**
\n\n- Consulting firms like **Deloitte, EY**\n\n\n- Banks like **HDFC, ICICI**\n\n\n- FMCG giants such as **HUL, ITC**\n\n\n- Startups and tech-enabled service firms\n\nThere’s also a growing trend of hybrid roles that require comfort with both data and strategy—especially in startups and product-led companies.\n\n\nIn today’s economy, data isn’t just valuable, it’s essential. Both Data Analytics and Business Analytics play key roles in shaping smarter decisions, leaner processes, and better business outcomes.\nThe key difference is simple: **Data Analytics finds the truth hidden in numbers, while **Business Analytics** decides what to do with it.**\nIf you enjoy working with data at a technical level, coding, or stats, Data Analytics might be your path. If you’re more interested in using data to answer business questions and make strategic calls, Business Analytics is a great fit. Either way, one thing’s clear: the future belongs to those who can speak the language of data, and turn it into results.\n\n\n\n","blog_slug":"the-real-difference-between-data-analytics-and-business-analytics","published_date":"6th June 2025"}]},{"name_and_surname":"Venu Kumar.M","short_description":"I'm a Data Analyst with a consulting background. Proficient in SQL, Python, and Power BI","twitter_url":"https://www.linkedin.com/in/venukumar-m/","linkedin_url":"https://www.linkedin.com/in/venukumar-m/","designation":"Student, at Certisured, Bangalore.","image":{"localFile":{"childImageSharp":{"gatsbyImageData":{"layout":"constrained","backgroundColor":"#f8f8f8","images":{"fallback":{"src":"/static/026fdb844c10a689e7bf812b79130b06/4208c/743bb92a_61c2_463d_8066_7a49a6537615_7953556416.jpg","srcSet":"/static/026fdb844c10a689e7bf812b79130b06/69996/743bb92a_61c2_463d_8066_7a49a6537615_7953556416.jpg 122w,\n/static/026fdb844c10a689e7bf812b79130b06/cb495/743bb92a_61c2_463d_8066_7a49a6537615_7953556416.jpg 245w,\n/static/026fdb844c10a689e7bf812b79130b06/4208c/743bb92a_61c2_463d_8066_7a49a6537615_7953556416.jpg 489w","sizes":"(min-width: 489px) 489px, 100vw"},"sources":[{"srcSet":"/static/026fdb844c10a689e7bf812b79130b06/ca7c1/743bb92a_61c2_463d_8066_7a49a6537615_7953556416.webp 122w,\n/static/026fdb844c10a689e7bf812b79130b06/0486d/743bb92a_61c2_463d_8066_7a49a6537615_7953556416.webp 245w,\n/static/026fdb844c10a689e7bf812b79130b06/0b474/743bb92a_61c2_463d_8066_7a49a6537615_7953556416.webp 489w","type":"image/webp","sizes":"(min-width: 489px) 489px, 100vw"}]},"width":489,"height":542}}}},"blogs":[{"title":"File Handling in python ","Descrption":"### **File Handling in Python**\nFile handling in Python, python has tools to interact with data through files. File handling allows users to create or read or write the data in to the files. Files could be of any format like CSV, excel, Jason, etc..\n\nThe file handling functions in python\nPython has a set of built-in functions for file handling, let's see some of its essential functions,\n\n### **1. open() function:**
\nThis is the basic file function to interact with files, it takes two arguments the file name and the mode we want to open the file in (e.g., \"read\", \"write\", \"append\" etc...)\n\n- **read() method :** This method allows users to read the entire content of a file. It is denoted by the character 'r'. Using this method files cannot be modified\n\n***Example:-***\nOpen a file named \"data.txt\" in read mode (\"r\")\nfile = open('data.txt', 'r')\ncontent = file.read()\nprint(content)\nfile.close()\n\n- **write() method:** This method is used to write data to a file, It is denoted by the character 'w'. Using this method the existing files are overwritten otherwise, this creates a new file when the file doesn’t exist\n\n\n\n***Example:-***\n#Open a file named 'data.tx' in write mode ('w')\nfile = open('data.txt', 'w')\nfile.write('This is some new data!')\nfile.close()\n\nappend() method: \n\nSimilar to write() method, but this method adds new data to the end of the file without erasing existing content\n\n***Example:-***\n#Open a file named 'data.txt' in append mode ('a')\nfile = open('data.txt', 'a')\nfile.write('\\nHere's some additional text!')\nfile.close()\n\nbinary method 'b’: \n\nThis method is used to handle binary files like jpg, mp4, mp3 etc.. It is denoted by the character 'b'. 'rb' – is used to read binary and 'wb' – is used to write binary\n\n***Example:-***\n\n#Open a binary file named 'image.jpg' in read binary mode ('rb')\nfile = open('image.jpg', 'rb')\nimage_data = file.read()\nfile.close()\n\nexclusive creation method 'x': \n\nThis mode is used to create a new file, It is denoted by the character 'x'\n\n***Example:-***\nfile = open('new_file.txt', 'x')\nfile.write('This is a new file.')\nfile.close()\nprint('File created successfully.')\n\n#### **2. close() function:**
\nOnce users are done working with a file, its crucial to close the current file, we use the close() method to release resources and avoid errors.\n\n***Example:-***\nfile = open(\"data.txt\", 'r')# Open a file\n\n#Users file operations here (read/write)\nfile.close()\n\n\n### ***Note:-***\n\nAppend Read and write in a file with 'a+':\n\nIn 'a+' method, the new data is appended at the end of the file, '+' creates or reads the existing/new file\n\nRead and write in a file with 'r+' & 'w+':\n\nIn r+ & w+ method, they can perform both read and write on the file, but overwrite the data from the beginning of file\n\n\nDifference between 'r+' and 'w+':\n\nIn 'r+' it gives an error if the file does not exist, whereas 'w+' creates a new file if there is no file\n'r+' opens the file without deleting content whereas 'w+' opens the file by deleting the contents of the file\n\n### ***Summary***\n\nPython provides set of tools for file handling, allowing users to interact with various data formats like CSV, Excel, and JSON etc.,. With these tools, one can perform activities like,\nCreate new files: Start fresh with open()\nRead existing files: Access information using open() in 'r' mode\nWrite data to files: Modify or create content using open() in 'w' mode (existing content will be overwritten)\nAppend data to files: Add new information to the end of a file without erasing existing data using open() in 'a' mode\nHandle binary files: Work with images, audio, and other non-text data using open() with 'b' mode (e.g., 'rb' for reading binary, 'wb' for writing binary)\nclose() function to release resources and avoid errors after file operations\nBy understanding the different file handling methods (open(), read(), write(), append(), close()) and their modes ('r', 'w', 'a', 'b', 'x', 'r+', 'w+'), users can effectively manage their data\n","blog_slug":"file-handling-in-python","published_date":"16 August 2024"}]},{"name_and_surname":"Tanishq Barol","short_description":"I am Tanishq Barol, a BA Graduate from Lovely Professional University with majors in Journalism and minors in English Literature. Currently working as a Graphic Designer (freelance) while attending Applied Business Analytics course at Certisured. Analytics. I am interested in recognising meaning business insights and improving my ability to present them.","twitter_url":null,"linkedin_url":"https://www.linkedin.com/in/tanishq-barol-33333b189/","designation":"Business Analyst Intern","image":{"localFile":{"childImageSharp":{"gatsbyImageData":{"layout":"constrained","backgroundColor":"#383848","images":{"fallback":{"src":"/static/adf3ae4896b87fa681b139b8e4866b43/32802/Whats_App_Image_2025_05_22_at_3_30_46_PM_1b7644fa96.jpg","srcSet":"/static/adf3ae4896b87fa681b139b8e4866b43/a9246/Whats_App_Image_2025_05_22_at_3_30_46_PM_1b7644fa96.jpg 231w,\n/static/adf3ae4896b87fa681b139b8e4866b43/7b603/Whats_App_Image_2025_05_22_at_3_30_46_PM_1b7644fa96.jpg 462w,\n/static/adf3ae4896b87fa681b139b8e4866b43/32802/Whats_App_Image_2025_05_22_at_3_30_46_PM_1b7644fa96.jpg 924w","sizes":"(min-width: 924px) 924px, 100vw"},"sources":[{"srcSet":"/static/adf3ae4896b87fa681b139b8e4866b43/6ca4e/Whats_App_Image_2025_05_22_at_3_30_46_PM_1b7644fa96.webp 231w,\n/static/adf3ae4896b87fa681b139b8e4866b43/cb9fa/Whats_App_Image_2025_05_22_at_3_30_46_PM_1b7644fa96.webp 462w,\n/static/adf3ae4896b87fa681b139b8e4866b43/49ad1/Whats_App_Image_2025_05_22_at_3_30_46_PM_1b7644fa96.webp 924w","type":"image/webp","sizes":"(min-width: 924px) 924px, 100vw"}]},"width":924,"height":1064}}}},"blogs":[{"title":"Importance and scope of Data Analytics in Defence Industry","Descrption":"Envision military personnel equipped with immediate intelligence concerning enemy activities, logistics specialists forecasting supply chain disruptions before they happen, and planners devising successful strategies from extensive battlefield data. The predictive analysis for defence is no longer science-fiction ; it signals the ever-expanding potential of data analytics in transforming defense operations for the brave new world.\n\nIn the military, as in civilian sectors, information reigns supreme. Contemporary conflicts produce an overwhelming volume of data from sensors, drones, intelligence reports, and other sources. The conversion of this data into useful knowledge is fundamentally reliant on data analytics, which involves both the art and science of uncovering significant trends and insights from an extensive body of satellite and human intelligence data, enabling military forces to make quicker, more crucially informed decisions.\n\n### **Essentiality of Data Analytics in Defence**\n1. **Anticipating threats:** By examining both historical and contemporary data, analysts can detect potential threats and hotspots before they intensify, facilitating preemptive actions. \n2. **Enhancing operations:** Real-time data analysis can optimize logistics, resource distribution, and troop movements, thus increasing overall efficiency and effectiveness.\n3. **Gaining insight into adversaries:** Scrutinizing enemy communications, movement patterns, and social media interactions can yield critical intelligence regarding their strategies and weak points.\n4. **Advancing weaponry:** Data analytics supports the development and implementation of sophisticated weapon systems and technologies custom-tailored to address specific threats.
\n ### **Unlocking Secrets:** Data Analytics Elevating Military Intelligence.\n\nPicture intelligence officers meticulously analyzing voluminous reports, akin to detectives in a gripping global drama. Now, envision them empowered by data analytics, facilitating the transformation of raw data into coherent representations of enemy maneuvers, covert networks, and emerging threats. This scenario represents the current state of data analytics within military intelligence, fundamentally altering the landscape.\n\nHistorically, intelligence gathering depended on human scrutiny, a process often slow and laborious. However, today’s battlefield generates vast amounts of information—from satellite imagery and intercepted communications to social media activity and financial transactions—which is beyond the analytical capabilities of human agents alone.Data analytics effectively fills this gap. \n\n### **Serving as a pivotal resource for intelligence agencies**\n1. **Discover concealed patterns:** Sophisticated algorithms can discern links and trends unattainable to human analysts, uncovering secret networks, emerging threats, and enemy intentions.\n2. **Forecast future events:** By evaluating past data and present trends, analysts can more accurately predict when and where incidents may unfold, granting military leaders a crucial advantage in strategic decision-making.\n3. **Target operations accurately:** Data assessment can identify enemy positions, critical infrastructure, and even the anticipated effectiveness of specific military initiatives, leading to more surgical and efficient operations.
\n**Real-world instances highlight data analytic's transformative effect on military intelligence:**\n\n- **Tracking terrorism networks:** In 2011, the U.S. military harnessed data analytics to locate and dismantle the group behind the foiled Times Square bombing, showcasing the efficacy of social media and financial activity analysis.\n\n- **Foreseeing troop movements:** During the Iraq conflict, data analytics facilitated predictions regarding enemy troop movements and ambushes, enhancing counterinsurgency measures.\n\n- **Locating concealed armaments:** In Afghanistan, data examination identified hidden weapon stockpiles by analyzing satellite images and terrain information, resulting in the confiscation of significant quantities of explosives.\n\nThese illustrate how data analytics is reshaping military intelligence, with a future ripe for possibilities, ranging from facial recognition to sentiment evaluations, progressing toward an increasingly data-dependent intelligence collection landscape.\n\n### **Beyond Raw Strength: Empowering the Defense Sector with Data Analytics.**\n\nVisualize a defense force capable of predicting equipment malfunctions, optimizing logistics in real time, and forecasting enemy advances through data insights. This reflects the role of data analytics in modern defense, where military capabilities are assessed not solely by physical prowess but equally by data intelligence.\n\nAnd therein lies the importance of data in safeguarding nations. \n\n### **Exploring the multifaceted use of data analytics in defense can highlight its relevance:**\n1. **Predictive maintenance:** By assessing sensor data from various equipment, AI-enhanced systems can foresee potential failures, thus averting costly downtimes and ensuring operational readiness.\n2. **Cybersecurity:** Monitoring network activity and user behavior patterns enables early detection and prevention of cyber threats, protecting vital infrastructure and confidential data.\n3. **Logistical efficiency:** Analyzing transportation data, meteorological conditions, and resource availability allows for improved military logistics, ensuring resources are delivered efficiently even under challenging conditions.\n4. **Precision in target identification:** Utilizing intelligence data from diverse sources enables accurate targeting of enemy entities, thereby reducing collateral damage and enhancing mission efficacy.\n5. **Threat forecasting and identification:** Analyzing social media interactions, communication behaviors, and financial trends reveals potential threats and areas of concern, allowing for prompt and proactive responses.\n\nThese examples exemplify the far-reaching applications of data analytics in defense operations. \n\n### **The implications for defence-oriented decision-making:**\n1. **Accelerated and informed decision-making:** Real-time data insights empower leaders to make rapid and knowledgeable choices in urgent situations, yielding a significant tactical edge.\n2. **Resource allocation based on data:** Evaluating resource usage patterns allows commanders to strategically distribute personnel, equipment, and supplies to maximize impact.\n3. **Minimized risk and uncertainty:** Data analysis elucidates potential risks, paving the way for proactive countermeasures to mitigate them.\n4. **Enhanced situational awareness:** Combining data from various channels fosters a comprehensive understanding of the battlefield landscape, resulting in better tactical planning.\n\nData analytics has evolved into not just a tool but a pivotal factor in modern defense strategies. By leveraging data effectively, militaries are better positioned to operate with heightened efficiency, ensuring national security in a complex and data-centric world.\n\n### **Fortifying Cyber Defenses: How Analytics Creates Strongholds.**\n\nEnvision a digital front where cyberattacks bombard systems, threatening to undermine confidential information, disrupt crucial infrastructure, and incite disorder. In this dynamic environment, conventional defense tactics frequently fall short. Here is where data analytics emerges as an indispensable asset, essential for reinforcing cybersecurity and safeguarding important data.\n\n### **Data analysis contribution to combating cyber threats**\n1. **Enhanced threat identification:** Advanced analytics are capable of dissecting extensive datasets related to network interactions, user activities, and system logs to detect anomalies and suspect patterns indicative of current or looming attacks.\n2. **Proactive threat management:** Beyond detection, data analytics provides predictive capabilities. By scrutinizing historic attack trends and newfound vulnerabilities, security teams can foresee potential threats and preemptively implement defenses.\n3. **Optimized incident response:** In the event of a breach, rapid response is vital. Data analytics enables incident response teams to identify the attack's origin, assess its extent, and prioritize containment strategies swiftly, thereby minimizing impacts and expediting recovery.\n4. **Automated defense systems:** In the face of increasingly sophisticated cyber threats, automated security solutions powered by data analytics can respond to incidents in real time, neutralizing threats before they escalate.\n\n### **Practical implications of data analytics in cybersecurity scenarios**\n- **Financial sectors:** Analytics can identify fraudulent transactions in real-time, halting suspicious activities before significant losses accumulate.\n- **Critical infrastructure:** By examining sensor data and traffic patterns, security analysts can prevent cyberattacks aimed at essential utilities and services.\n- **Healthcare systems:** Data analytics assists in protecting patient information by identifying unauthorized access attempts and potential breaches.\n\nAs the landscape of technology advances, so too will the complexity of cyber threats. Data analytics stands not merely as a temporary defense but as a fundamental aspect of ongoing cybersecurity efforts. As it continually adapts and evolves, data-driven security solutions become essential to safeguarding our digital environments.\n\n### **Future Directions: Mapping the Data-Driven Battlefield**\nThe battlefront of the future will not solely hinge on the size of armed forces or ordinance but rather on the adeptness in data management. Data analytics is currently transforming defense paradigms, signaling a progression towards an even more data-centric operational approach. Consider the upcoming trends shaping this landscape:\n1. **Artificial intelligence (AI) and machine learning (ML):** These potent technologies will enable advanced analysis, predictive insights, and potentially autonomous decision-making during critical scenarios.\n2. **Big Data and the Internet of Things (IoT):** The increasing volume and diversity of data amassed from connected devices will necessitate sophisticated analytic tools to unleash their full potential—such as leveraging soldier wearable data for performance optimization and health monitoring.\n3. **Quantum computing:** This groundbreaking technology promises to resolve computational challenges previously deemed insurmountable, potentially enabling revolutionary advancements in fields like cryptography, logistics, and timely threat assessment.\nThese insights represent just a fraction of the forthcoming potential of data analytics within defense sectors. Continuous innovation ensures that the possibilities are expansive.\n\n### **Conclusion: Data — The Strategic Asset of the Future**\nThe evidence is clear: data analytics has become indispensable to contemporary defense methodologies. By translating data into actionable intelligence, militaries are positioned to operate with superior efficiency, effectiveness, and precision. From forecasting threats to streamlining logistics and enhancing cybersecurity, data analytics serves as a cornerstone for informed decision-making, granting a decisive advantage in combat scenarios.\n\nThis journey, however, is ongoing. The evolution of data analytics is a continuous process, uniquely attuned to emerging technologies and challenges. By fully embracing and investing in this powerful instrument, military establishments can better prepare for the intricate and data-driven future of warfare. In the realm of defense, data transcends mere information; it embodies the ability to foresee, guard against, and succeed.\n\n","blog_slug":"importance-and-scope-of-data-analytics-in-defence-industry","published_date":"22 May 2025"}]},{"name_and_surname":"Prithvi Raj","short_description":"I am Prithvi Keshava is a ISE Bachelors Graduate from Bangalore, who was involved in AR/VR Development, with interest in the field of Data Science and Machine Learning","twitter_url":null,"linkedin_url":null,"designation":"Data Analyst Intern","image":{"localFile":{"childImageSharp":{"gatsbyImageData":{"layout":"constrained","backgroundColor":"#080808","images":{"fallback":{"src":"/static/73a36110311f2ef491403ed486bcaf08/d9cd9/Whats_App_Image_2025_05_23_at_11_28_03_AM_4b91ac8eea.jpg","srcSet":"/static/73a36110311f2ef491403ed486bcaf08/47930/Whats_App_Image_2025_05_23_at_11_28_03_AM_4b91ac8eea.jpg 400w,\n/static/73a36110311f2ef491403ed486bcaf08/baaed/Whats_App_Image_2025_05_23_at_11_28_03_AM_4b91ac8eea.jpg 800w,\n/static/73a36110311f2ef491403ed486bcaf08/d9cd9/Whats_App_Image_2025_05_23_at_11_28_03_AM_4b91ac8eea.jpg 1599w","sizes":"(min-width: 1599px) 1599px, 100vw"},"sources":[{"srcSet":"/static/73a36110311f2ef491403ed486bcaf08/416c3/Whats_App_Image_2025_05_23_at_11_28_03_AM_4b91ac8eea.webp 400w,\n/static/73a36110311f2ef491403ed486bcaf08/c1587/Whats_App_Image_2025_05_23_at_11_28_03_AM_4b91ac8eea.webp 800w,\n/static/73a36110311f2ef491403ed486bcaf08/cf508/Whats_App_Image_2025_05_23_at_11_28_03_AM_4b91ac8eea.webp 1599w","type":"image/webp","sizes":"(min-width: 1599px) 1599px, 100vw"}]},"width":1599,"height":1599}}}},"blogs":[{"title":"Understanding Machine Learning Explanations: How LIME Builds Trust and Insights","Descrption":"Machine learning is transforming the world — diagnosing diseases, recommending music, detecting fraud. But behind these impressive capabilities is a big problem: most machine learning models can’t explain why they make the predictions they do.\nImagine asking a doctor for a diagnosis, and they respond, “Because the algorithm said so.” That’s not very reassuring, especially when lives or major decisions are at stake.\nThis is where **LIME** comes in — a clever method that peeks inside the black box and tells us, in plain language, what’s really going on.
\n\n### **What is LIME?**\n\n\n**LIME** stands for **Local Interpretable Model-agnostic Explanations**. Sounds technical, but let’s break it down:
\n- **Local:** LIME doesn’t try to explain the entire model (which can be wildly complex). It focuses on explaining a single prediction — just like zooming in on one neighbourhood in a giant city.\n- **Interpretable:** It uses simple models (like linear regression) that humans can actually understand.
\n- **Model-agnostic:** It works with any machine learning model — neural networks, random forests, SVMs — like a universal translator for AI.\n\n### **A Simple Analogy**
\nImagine your machine learning model is a giant sculpture. It’s too big and too intricate to understand all at once. LIME gives you a flashlight and says, “Let’s shine it on just this part, and I’ll explain what’s going on here.” You may not get the full sculpture, but you can understand what part you’re looking at and why it looks that way.\n\n### **Why Explanations Matter**\nLet’s say you build a system to detect whether someone has the flu. It says “Yes” for a particular patient. That’s helpful, but you (or a doctor) might ask:
\n“Why did it say yes? What symptoms tipped the scale?”
\nWithout an answer, you’re being asked to trust a machine with no reasoning. With LIME, you might get:
\n- Sneezing → supports flu diagnosis\n- Headache → supports flu diagnosis\n- No fatigue → speaks against flu\n\nNow the doctor can make an informed judgment. LIME doesn't just say what the model predicts — it shows why. That builds trust.\n\n\n### **How LIME Works**
\nLIME explains any model's prediction by learning a simple, interpretable model close to the original — but only around the specific instance being predicted.
\n**1. Take the original prediction** - Let’s say a model predicts a picture is a \"Labrador.\"
\n**2. Create tiny changes** - LIME makes small, random tweaks to the input (e.g., remove parts of the image or change words in a sentence).
\n**3. See how the prediction changes** - It observes how the model's decision changes with each tweak.
\n**4. Train a simple model** on these new, tweaked samples. The goal? Capture how the original model behaves just around that prediction.
\n**5. Highlight important features** - LIME shows you which parts of the image or text mattered most in that local decision.
\nFor example, in text classification (like classifying news articles), LIME looks at the presence or absence of words and figures out which words most influence the prediction. In image classification, it examines super-pixels (contiguous pixel regions) and highlights those crucial for the decision.\n\n### **Real-World Applications**
\n- **Text:** Explaining why a support vector machine labelled a document as \"Christianity\" or \"Atheism.\" Sometimes, the model picks words that don't make sense, like headers or names, which reveals dataset issues rather than meaningful patterns.\n\n- **Images:** Showing which parts of a picture led a neural network to say \"electric guitar\" or \"Labrador.\" For example, a model might focus on the fretboard of a guitar or the shape of a Labrador, giving us insight into its reasoning.\n\n\n### **Beyond Single Predictions: Explaining the Whole Model**
\nLooking at one prediction is helpful, but understanding the overall trustworthiness requires seeing multiple examples. LIME includes a method called SP-LIME, which selects representative, diverse predictions to present a broader picture of how the model behaves. This helps identify patterns or irregularities, like spurious correlations the model might be relying on.\n\n### **Trust and Human Judgment**
\nResearchers conducted experiments where non-expert users examined explanations and made decisions:
\n- **Choosing the Best Model:** Users could pick which of two models would perform better in the real world by looking at explanations, even when traditional accuracy metrics were misleading.
\n- **Improving Models:** Users identified features (like words) that didn't generalize well and removed them, improving the model's performance without expert knowledge.
\n- **Detecting Flaws:** Explanations revealed when models relied on irrelevant cues. For example, a model trained to distinguish wolves from huskies was actually using snow in the background as a shortcut. When shown explanations, users recognised this flaw, understanding that the model's reasoning was flawed and that it wouldn't work well outside the training conditions.\n\n### **A Cautionary Tale: Husky vs. Wolf**
\nIn a specific example, a model was trained to tell apart wolves and huskies. It relied on snow as a key feature: wolves were correctly classified when snow was present, but if the background was different, the model would err. When humans saw the explanations, they understood the model's reliance on snow rather than actual animal features. This insight was crucial because it showed the model wouldn't \n\nperform well in different environments — a lesson that raw accuracy alone couldn't reveal. \n\n### **Conclusion**
\nLIME helps bridge the gap between complex models and human understanding. By providing simple, faithful explanations, it enables users to trust, evaluate, and improve machine learning systems. Whether identifying dataset issues, choosing the right model, or understanding why a prediction was made, explanations build confidence — especially when models are used in critical areas. As AI continues to evolve, tools like LIME will be key to making machine learning transparent and trustworthy.\n\n\n\n\n","blog_slug":"understanding-machine-learning-explanations-how-lime-builds-trust-and-insights","published_date":"24 th May 2025"},{"title":"The BigChaos Approach to the Netflix Grand Prize","Descrption":"### **Introduction: A Challenge from Netflix**\nBack in 2006, Netflix—the streaming giant—threw down a challenge that sparked one of the most famous competitions in data science history. They offered $1 million to anyone who could beat their in-house recommendation algorithm, Cinematch, by at least 10%. The task? Predict how users would rate films they hadn’t yet watched. Sounds simple, doesn’t it? \n\nNot quite. With over 100 million ratings from 480,000 users across nearly 18,000 movies, this was a monumental data puzzle. Enter \"BigChaos\", an Austrian team that later joined forces with others to form BellKor’s Pragmatic Chaos—the eventual winners of the Netflix Prize. \n\nThis article breaks down the key concepts behind BigChaos’s approach and how their clever combination of maths, intuition, and engineering won the day. \n\n### **Understanding the Problem: Predicting Preferences**\nAt its core, the Netflix Prize was about **collaborative filtering** —a method that uses the preferences of many people to recommend things to others. Imagine you're at a dinner party. If someone who loves the same films as you does, recommends a movie, you’re likely to enjoy it too. That’s collaborative filtering in a nutshell. \nBut predicting individual taste is messy. People’s moods change, their preferences evolve, and films are more complex than just a number out of five. That’s where clever modelling comes in. \n\n\n\n### **Data and Evaluation**\n- **Training Data:** The dataset provided included 100,480,507 ratings from 480,189 users for 17,770 movies \n- **Evaluation Metrics:** Participants' algorithms were evaluated based on Root Mean Squared Error (RMSE) between predicted and actual ratings. \n- **Test Set:** The test set contained over 2.8 million ratings, with half used for evaluation and the other half kept secret to prevent overfitting\n\n\n\n### **The BigChaos Strategy: More Than One Brain**\n#### **1. Ensemble Learning: A Team of Models**\nBigChaos didn’t just rely on one method—they used many, and blended their results, nearly 800 Models. This idea is called **ensemble learning**. \n\nThink of it like asking a panel of film critics for their opinion rather than trusting one alone. Each critic sees the film differently, but together they reach a balanced view. By blending dozens of algorithms, BigChaos smoothed out the rough edges of each, leading to much sharper predictions.\n\n#### **2. Matrix Factorisation: Finding Hidden Preferences**\nOne of the key techniques used was **matrix factorisation**, particularly **Singular Value Decomposition (SVD)**. \nHere’s the gist: take a huge table of users and movies where each cell has a rating (or is blank). Matrix factorisation breaks this table down into smaller pieces that capture “latent factors”—invisible qualities like whether someone likes action over romance, or prefers old films to new ones. \n\nIn simpler terms, it’s like mapping each user and movie into a secret “taste space”. The closer a user and a movie are in that space, the higher the rating. \n\nBigChaos also added **bias terms** (adjusting for users who always rate high or low, or movies that are universally liked) and **regularisation** (to avoid overfitting—essentially stopping the model from being too clever for its own good).\n\n#### **3. Temporal Dynamics: Taste Over Time**\nHere’s a subtle but powerful insight: people’s preferences change. What you liked five years ago might bore you now. Some movies also trend and fade. \n\nBigChaos accounted for this with **temporal dynamics**. They adjusted their predictions to account for time-based shifts in user behaviour and film popularity. It’s a bit like saying, “This user used to love rom-coms, but lately, it’s all thrillers”.\n\n\n\n\n#### **4. Feature Engineering: The Art of Data Preparation**\nBefore you build anything, you need clean materials. BigChaos spent enormous effort **cleaning the data, normalising ratings**, and crafting new features—extra bits of information, like how often a user watches movies or whether they favour recent releases. \n\nThink of it as polishing your tools before carving a sculpture. Better input leads to better output.\n\n### **Collaboration and the Winning Moment**\nBy 2008, BigChaos had merged with BellKor, a top-performing American team, and later joined forces with Canada’s Pragmatic Theory. Each brought something unique: BigChaos offered modelling variety and robust blending techniques, BellKor brought advanced matrix methods, and Pragmatic Theory contributed insights into different user types (e.g., solo vs family watchers). \nThe combined team submitted their final solution in July 2009—achieving an RMSE (Root Mean Square Error—a measure of prediction accuracy) of **0.8567**, beating Netflix’s target of 0.8572 by the narrowest of margins. \nThey weren’t alone: another team, \"The Ensemble\", submitted the same score just minutes later. But under the rules, the earliest submission won. BellKor’s Pragmatic Chaos—and BigChaos within it—took home the million-dollar prize.\n\n### **Legacy: Why It Still Matters**\nThe Netflix Prize was more than a competition; it was a catalyst for a new wave of **machine learning** and **recommender systems** research. Techniques like matrix factorisation and ensemble learning became foundational in platforms like YouTube, Spotify, and Amazon. \nBigChaos’s contributions remain influential. They showed the power of teamwork, of combining different models and perspectives, and of paying attention to every detail—from temporal tweaks to user quirks. \nMost of all, they proved that solving real-world problems with data isn’t just about flashy algorithms—it’s about thoughtful engineering, human insight, and a touch of chaos.\n\n### **Glossary of Key Concepts**\n- **Collaborative Filtering:** Predicting a user’s interests by looking at others with similar tastes. \n- **Ensemble Learning:** Combining the predictions of multiple models to improve accuracy. \n- **Matrix Factorisation / SVD:** A way to discover hidden patterns in user preferences by reducing a large table into lower-dimensional representations. \n- **Bias Term:** A correction factor for consistently high or low ratings. \n- **Regularisation:** A technique to prevent a model from becoming too tailored to training data. \n- **Temporal Dynamics:** Accounting for changes in behaviour over time. \n- **Feature Engineering:** Creating new inputs to help a model understand the data better. \n- **RMSE (Root Mean Squared Error):** A standard way of measuring the accuracy of predictions.\n\n### **Further Reading**\nResearch Paper: https://www.asc.ohiostate.edu/statistics/statgen/joul_aut2009/BigChaos.pdf \nPresentation Slides: https://files.speakerdeck.com/presentations/5036d8d208022000020309e3/NetflixPrize.pdf","blog_slug":"cracking-the-code-the-big-chaos-approach-to-the-netflix-grand-prize","published_date":"31st May 2025"},{"title":"How AI’s Hidden Flaw Could Send Innocent People to Jail","Descrption":"\n\nThis is a research paper dating back to 2016, researchers Xiaolin Wu and Xi Zhang published a paper claiming their AI could identify criminals from face photos with nearly 90% accuracy. This idea sounds like something out of a film and many people found it disturbing. The big question was: if we could predict who is a criminal just by looking at their face, how would that change our ideas of innocence and guilt?
\nThis isn’t anything new. In the 1800s, Cesare Lombroso believed that certain facial features and physical traits could reveal if someone was born a criminal, but his theories have been thoroughly discredited and outright rejected. Wu and Zhang’s work tries to revisit that old idea using Machine learning, claiming that their algorithm can spot “criminal” faces.
\n\n### **How the AI System Was Trained**\nWu and Zhang used a machine learning model to analyse facial images from 1856 individuals, roughly half of whom were convicted criminals. They applied four different classifiers—logistic regression, KNN (k-nearest neighbours), SVM (support vector machines), and CNN (convolutional neural networks)—to distinguish between \"criminal\" and \"non-criminal\" faces. In theory, this would allow the AI to identify criminal tendencies purely from facial features, independent of human biases or emotions.\nThey say their algorithm isn’t biased like humans, because it doesn’t have emotions or prejudices. But that’s misleading. The data they used had two big issues: \n\n1. The photos of non-criminals were often taken from professional or social sites where people look their best, while criminals’ photos came from official IDs, which are usually more serious or unflattering\n\n\n\nSources to the Research Paper: https://arxiv.org/abs/1611.04135\n\n","blog_slug":"how-ai-s-hidden-flaw-could-send-innocent-people-to-jail","published_date":"5 th June 2025"},{"title":"Spurious Correlation: When the Data Lies to You","Descrption":"As data scientists, we thrive on the relationships between variables—what affects what, and how much. But what happens when those relationships are only skin-deep? Enter the world of spurious correlation—a statistical illusion where two variables appear to be related but aren’t, at least not in a meaningful or causal way.\nIt’s a trap that can ensnare even seasoned researchers, and it has real consequences. From flawed economic predictions to misleading health advice, the ripple effects of mistaking correlation for causation can be costly. Let’s break this down without getting too heavy, and point fingers (gently) at a few notable cases in the academic world.
\nWhat is a Spurious Correlation?\n\n\n\n\n\n\n\n\nA spurious correlation occurs when two variables move together—statistically speaking—but not because one causes the other. Instead, the correlation is often due to:
\n- **Coincidence**
\n- **A third (confounding) variable** influencing both
\n- **Autocorrelation** in time series data
\n- **Data dredging** (aka p-hacking)
\n\nConsider the classic example: the number of films Nicolas Cage appears in each year and the number of transportation security screeners in North Dakota. Over a certain period, the correlation was surprisingly high (r ≈ 0.902), but clearly, there's no causal link—unless Nic Cage’s appearance in the films indirectly caused it, which is highly unlikely.\n\n**Why Should Data Scientists Care?**
\nBecause we’re building models, making forecasts, and nudging business or scientific decisions based on patterns in data. A spurious correlation might make your model look good on paper (especially in-sample), but it will **collapse under scrutiny or in real-world application.**
\n- In machine learning, spurious features might creep into your predictors.\n- In causal inference, you might mistake an artefact for a genuine effect.\n- In time series forecasting, you might overfit to coincidental movements.\n\n \n**Common Culprits Behind Spurious Correlation**
\n**1. Omitted Variable Bias**
\nLeaving out a key variable that drives both correlated variables. For instance, ice cream sales and shark attacks are correlated—but temperature (the third variable) drives both.\n\n**2. Non-stationarity in Time Series**
\nTwo unrelated time series with trends often appear correlated just because they’re both increasing or decreasing over time. This is why differencing or stationarity testing is essential in time series analysis.\n\n**3. Multiple Testing and P-Hacking**
\nRunning thousands of regressions until something sticks. Tools like p-hacker simulate this, showing how easy it is to find some significant-looking correlation by chance alone.\n\n\n**Papers Accused (Fairly or Unfairly) of Spurious Correlation**
\n\n**1. Reinhart & Rogoff (2010) – “Growth in a Time of Debt”**
\nThis influential paper claimed that countries with public debt over 90% of GDP experienced lower growth. But a later critique by Herndon, Ash, and Pollin (2013) found spreadsheet errors and argued that the correlation between high debt and low growth might be **spurious**, possibly driven by reverse causality (i.e., low growth causes debt).\n\n\n\n\n\n\n**2. Big Data and Predictive Policing**
\nStudies using social media or location data to predict crimes (e.g., \"predictive policing\" algorithms) have been criticised for drawing correlations that reflect existing biases in policing data rather than actual crime patterns. The data reflects where police look—not necessarily where crime occurs.
\n**3. “Red Wine and Health” Papers**
\nMultiple observational studies in the 2000s suggested that red wine drinkers were healthier, sparking headlines and a Pinot Noir renaissance. However, confounders like income, diet, and lifestyle were often not controlled, making the findings ripe for spurious interpretation.
\n\nEx. Copenhagen City Heart Study published in 2002. This study reported that moderate red wine consumption was associated with a 50% lower risk of mortality compared to non-drinkers\nhttps://journals.lww.com/epidem/fulltext/2002/03000/is_the_effect_of_wine_on_health_confounded_by.23.aspx\n \n\n**How to Spot and Avoid Spurious Correlation**\n\n\n- **Always explore causality:** Tools like** Granger causality, instrumental variables**, or causal **DAGs **help distinguish real drivers.\n- **Test for stationarity:** Use the Augmented Dickey-Fuller (ADF) test or KPSS test in time series before correlating.\n- **Correct for multiple comparisons:** Apply Bonferroni correction or false discovery rate (FDR) control when testing many variables.\n- **Use domain knowledge:** Correlation doesn’t imply causation—but **context** often does.\n\n**Conclusion:
\n Stay Sceptical, Stay Sharp**\nThe truth is, our world is full of complex interdependencies—and also a lot of noise. As data scientists, our job is part detective, part storyteller. And sometimes, a story that's too perfect just isn’t true.\nBe wary of easy wins and impressive R² values. If something seems too good to be true, dig deeper. The difference between a genuine insight and a spurious correlation can make or break your model, your business case—or even public policy.\nAnd remember: just because two lines wiggle together on a graph, it doesn’t mean they’re dancing to the same tune.\n \nFurther Reading\nTyler Vigen – Spurious Correlations (website & book)\nHerndon, T., Ash, M., & Pollin, R. (2013) – “Does High Public Debt Consistently Stifle Economic Growth? A Critique of Reinhart and Rogoff”\nJudea Pearl – “The Book of Why”, for understanding causality\nGranger, C. W. J. (1969) – “Investigating Causal Relations by Econometric Models and Cross-spectral Methods”\n\n\n","blog_slug":"spurious-correlation","published_date":"12th June 2025"}]},{"name_and_surname":"ShashiKumar G N","short_description":"I am currently pursuing an internship in Advanced Business Analytics, focusing on tools like Power BI, SQL, and data visualization. With a growing interest in data preparation and automation, I aim to bridge the gap between raw data and actionable insights for informed business decisions.","twitter_url":null,"linkedin_url":"https://www.linkedin.com/in/shashikumargn28/","designation":"Business Analytics Intern","image":{"localFile":{"childImageSharp":{"gatsbyImageData":{"layout":"constrained","backgroundColor":"#f8f8f8","images":{"fallback":{"src":"/static/fa47122e920e87c70fa1399e23173130/82c11/strapi_97fc4b1168.png","srcSet":"/static/fa47122e920e87c70fa1399e23173130/2fd20/strapi_97fc4b1168.png 125w,\n/static/fa47122e920e87c70fa1399e23173130/de391/strapi_97fc4b1168.png 250w,\n/static/fa47122e920e87c70fa1399e23173130/82c11/strapi_97fc4b1168.png 500w","sizes":"(min-width: 500px) 500px, 100vw"},"sources":[{"srcSet":"/static/fa47122e920e87c70fa1399e23173130/d66e1/strapi_97fc4b1168.webp 125w,\n/static/fa47122e920e87c70fa1399e23173130/e7160/strapi_97fc4b1168.webp 250w,\n/static/fa47122e920e87c70fa1399e23173130/5f169/strapi_97fc4b1168.webp 500w","type":"image/webp","sizes":"(min-width: 500px) 500px, 100vw"}]},"width":500,"height":500}}}},"blogs":[{"title":"Understanding ETL: A Beginner's Perspective for Business Analysts","Descrption":"### **Introduction**\nEver stared at a messy spreadsheet and wondered how on earth you’d turn that into anything useful?
\nMe too.
\nThat’s where ETL comes in.
\nETL stands for Extract, Transform, Load.
\nIt’s basically the process of taking raw data—often all over the place—then cleaning it up, and finally moving it somewhere you can actually use it (think Power BI dashboards or a database).
\nIn this guide, I’ll walk you through:\n- What ETL is (in plain English, no jargon)\n- Why every Business Analyst should care about it (spoiler: it saves you tons of headache)\n- A practical example of ETL in action\n- The tools you can try as a beginner\n- Key ETL steps you’ll use over and over\n \nReady? Let’s go.
\nSo… \n### **What Exactly Is ETL?**\nAt its core, ETL is a three-step data prep routine. Nothing magical, just logical steps that tame messy data.
\n\n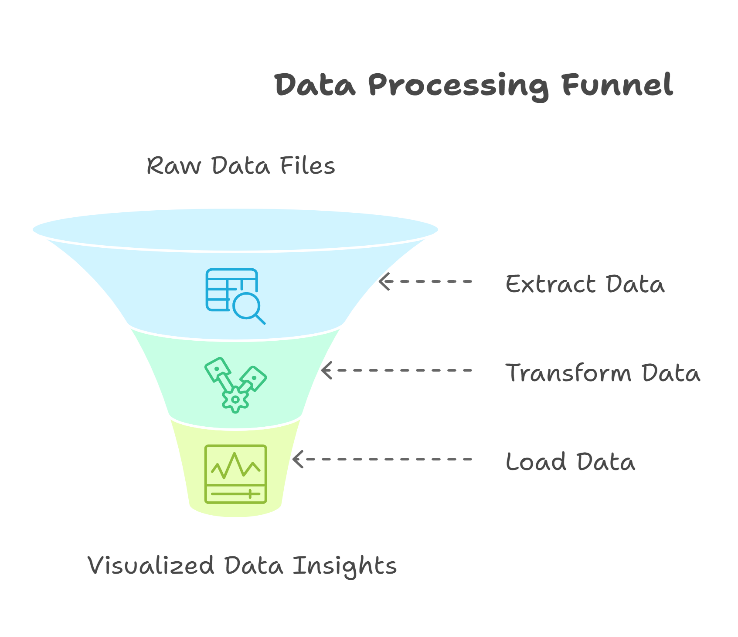\n\n1. **Extract:**\nYou grab data from wherever it lives: Excel files, SQL databases, maybe an API.
\nThink “collect all the ingredients.”
\n2. **Transform:**\nYou clean it: fix date formats, remove blank rows, correct typos, standardise values.\nYou might merge tables, calculate new fields (like profit margin), or pivot/unpivot data.\nThis is “cooking”—you shape and season the data so it’s tasty (aka usable).
\n3. **Load:**\nYou send the polished data into its final home: a Power BI dashboard, a SQL table, or maybe even a CSV that someone else will pick up.\nConsider it “serving the meal” for your colleagues
\n\nThat’s ETL in 30 seconds. It’s simple, but the power lies in making sure each step is done right. Skip one cleanup step, and your reports could be flat-out wrong.
\n\n### **Why Should You, as a Business Analyst, Care?**\nLet’s be real: business data is messy. Different teams use different formats. Dates in one sheet might be MM/DD/YYYY while another is DD-MM-YYYY. Sales figures might be written as “1,000” in one file and “one thousand” in another.\n\nIf you try to build a report on that chaos? You’ll get garbage in, garbage out.\n\nHere’s why ETL is your best friend:\n- **Consistency:** You make sure every column follows the same rules. Dates look the same. Numbers are numbers, not text.\n- **Accuracy:** You catch missing values, duplicates, weird outliers—before they mess up your insights.\n- **Efficiency:** Once you set up your ETL steps, you can refresh it with new data without starting from scratch. Less manual wrangling.\n- **Collaboration:** Your coworkers can tap into a clean dataset rather than each doing their own version of “data cleaning.” Less confusion, fewer mistakes.\n\nIn short, ETL frees you from the equivalent of bailing water out of a sinking boat—so you can finally focus on steering toward insights.
\n\n### **A Real-World ETL Example (for a Retail Sales Report)**\nImagine this: you need to put together a monthly sales performance report. The company has five regional branches. Each one sends you an Excel file. And—oh joy—each file has its own quirks.
\n**Step 1: Extract**
\n- Download all five Excel files from regional teams.\n- Run a SQL query to pull the master product list (with product names, categories, costs).\n\n**Step 2: Transform**\n- Remove irrelevant columns: Maybe one branch includes columns like “Store Manager Name” that you don’t need.\n- Fix date formats: Some use 1/5/2023; others use 2023-01-05. Choose one format—say, YYYY-MM-DD.\n- Clean blank or invalid rows: Sometimes the bottom rows are empty or have placeholders. Get rid of them.\n- Standardise sales figures: Convert text like “seven hundred” to the number 700.\n- Combine all five regional files into one master table.\n- Join that with the product list to add product names, categories, and cost.\n- Calculate a new column: profit per unit = SalePrice - Cost.\n\nAt this point, you have one tidy table with:
\n- Date (properly formatted)\n- Region\n- Product Name\n- Quantity Sold\n- Sale Price (numeric)\n- Cost (numeric)\n- Profit (calculated)\n\n**Step 3: Load**\n- Import the final table into Power BI.\n- Build visuals: total sales by region, top 10 products, profit trends over time, etc.\n- That’s it. You’ve gone from five messy, inconsistent files to a sleek dashboard. Your VP of Sales will love you. \n\n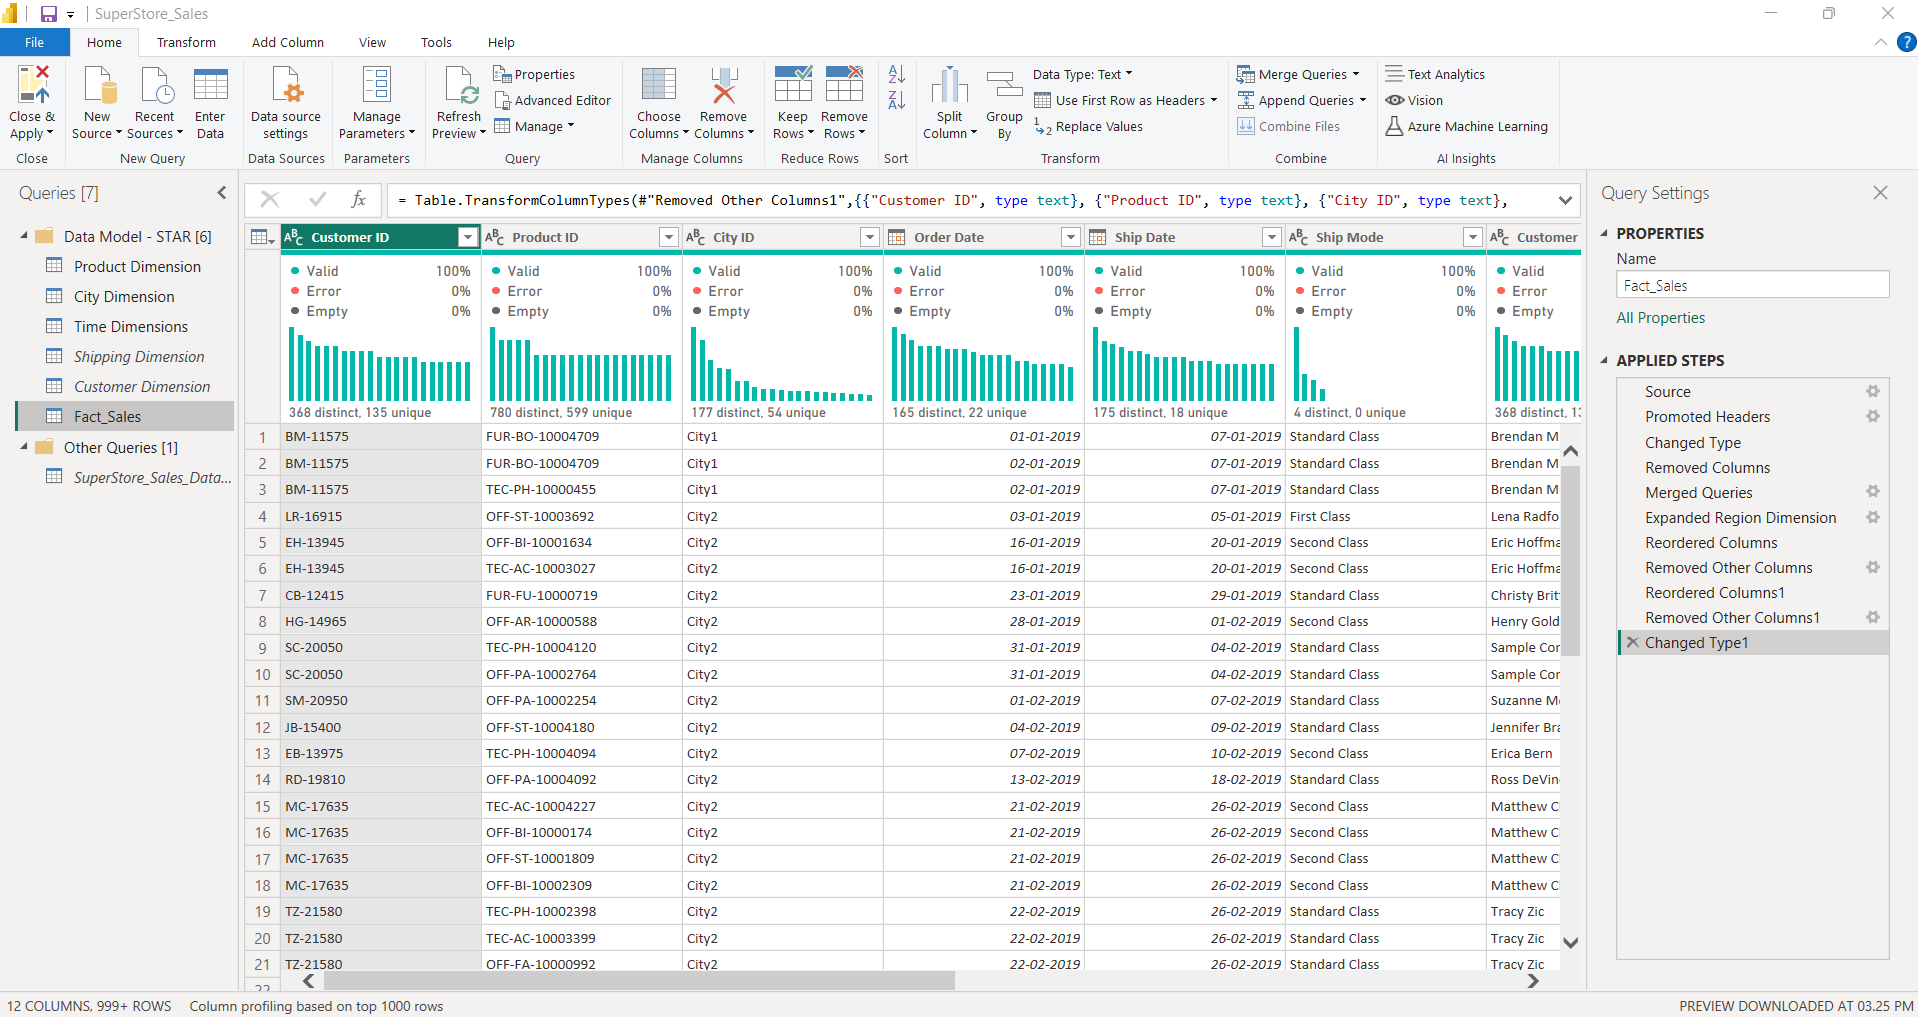\n\n\n### **ETL Tools You Can Start Using Today**\nYou don’t need a PhD in data engineering to do ETL. \nPlenty of user-friendly tools exist, especially for Business Analysts:\n\n**Beginner Tools That Support ETL**\n\nToday’s tools make ETL accessible even to those without technical expertise. Here are a few beginner-friendly options:\n\n| **Tool** | **Role in ETL** | **Why It’s Friendly** |\n| -------------------------- | ------------------- | ----------------------------------------------------------------------------------- |\n| **Power BI (Power Query)** | Extract & Transform | Drag-and-drop interface, step-by-step transformations, no coding needed |\n| **SQL** | Extract & Transform | Full control over data queries, great for large datasets |\n| **Excel** | Light Transform | Everyone knows it; decent for quick fixes like removing blanks and filtering rows |\n| **Power Automate** | Automate ETL | Allows workflow automation to fetch data, trigger transformations, and save outputs |\n\nTip: If you’re just getting started, dive into Power Query inside Power BI. It shows you each transformation step, so you can see—and later tweak—exactly how you turned raw data into a clean table.\n\n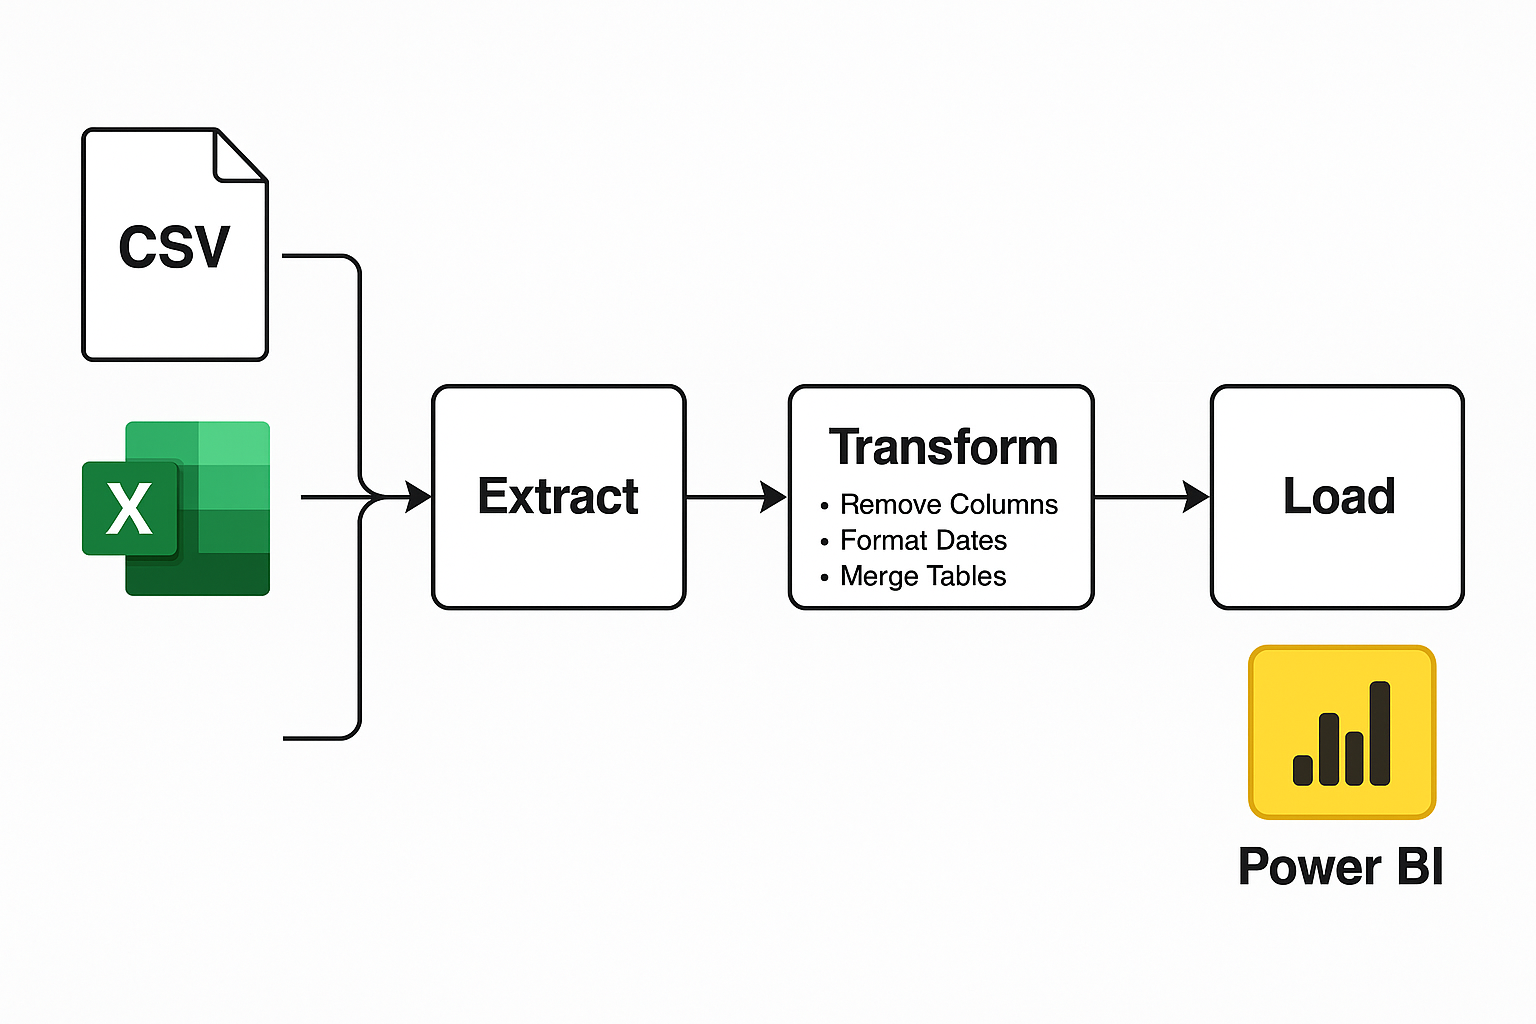\n\nBeyond those, you might see references to:
\n- **Open Source:** Apache NiFi, Talend Open Studio—powerful but a steeper learning curve.
\n- **Enterprise:** Informatica, IBM DataStage—big players for large companies.
\n- **Cloud-Native:** AWS Glue, Google Cloud Dataflow—great if your data lives in the cloud.
\n- **Code-Based:** Python (using libraries like Pandas, BeautifulSoup)—if you like scripting, this is extremely flexible.\n- **No/Low-Code:** Alteryx, Microsoft Power Query—handy for people who want minimal coding.\n\n Choose based on:
\n- Your skill level (no-code vs. code)
\n- Your budget (free vs. enterprise license)
\n- Where your data lives (on-prem vs. cloud)
\n\n### **Core ETL Actions You’ll Use All the Time**
\nOver time, you’ll notice some ETL steps come up again and again. These are your bread-and-butter moves:
\n**1. Assign Data Types:** Make sure “Date” columns are really dates (not text). Ensure “Sales” is a number, not text.
\n**2. Handle Nulls:** Replace missing values with defaults (e.g., 0) or drop those rows/columns entirely. Filter out invalid entries.
\n**3. Edit Columns:** Split a “Full Name” column into “First Name” and “Last Name.” Merge “City” and “State” into one field if needed. Rename columns for clarity.
\n**4. Filter Rows:** Keep only rows where Sales > 0. Remove entries before a certain date (e.g., older than one year).
\n**5. Join Tables:** Use a common key (e.g., ProductID) to merge sales data with product details.
\n**6. Pivot/Unpivot:** Turn columns into rows (or vice versa) to reshape data for reporting.
\n**7. Aggregate (Summarise):** Group by “Region” and sum “Sales”. Calculate average, min, max, etc., for a given \n column.\n\nMastering these actions means you can tackle almost any data-prep challenge that comes your way.\n\n### **ETL’s Critical Role in Business Intelligence**
\nData that hasn’t been through ETL is like ingredients scattered across your kitchen countertops—impossible to turn into a meal unless you gather, wash, chop, and cook.
\n\nIn BI work, ETL ensures you’re not just looking at raw chaos. Instead, you’re looking at a clean, consistent dataset that tells a story:\n\n- **Consolidation:** Bring regional or departmental data into one place so comparisons make sense.
\n- **Standardisation:** Make sure everyone’s using the same definitions (e.g., “Revenue” means the same thing \n everywhere).
\n- **Validation:** Catch mistakes—like a date that says “30/02/2023”—before they ruin your charts.
\n- **Automation:** Once your ETL steps are defined, you can refresh monthly (or daily) without starting over.
\n\nWithout ETL, you either spend hours (or days) cleaning data by hand, or you make decisions based on flawed information. Neither is a good look.\n\n### **Quick Comparison: ETL vs. ELT**\nYou might have heard the acronym ELT (Extract, Load, Transform). It’s similar to ETL, but the order is different:\n\n| **Characteristic** | **ETL** | **ELT** |\n| ---------------------------- | ------------------------------------ | ------------------------------------------- |\n| **When Data is Transformed** | Before loading into destination | After loading into destination |\n| **Storage** | Only transformed data stored | Raw + transformed data stored |\n| **Best for** | On-premise systems, smaller datasets | Cloud-based systems with high compute power |\n\n**ETL:** Clean data first, then load. Good if you have limited storage or need only the final table.
\n**ELT:** Load raw data into a data lake or data warehouse, then transform using powerful cloud resources.
\n\nIf you’re working in Power BI or local SQL Server, ETL is usually simpler. But if your company uses Snowflake or BigQuery, you’ll see ELT workflows more often.\n\n### **Conclusion**\nETL isn’t just another technical step in the data workflow—it’s the part that quietly does the heavy lifting. For Business Analysts, it’s what helps turn messy, scattered data into something clean, usable, and actually meaningful.\n\nIf you're just getting into it, don’t rush. Start small. Maybe it’s a few Excel sheets, or a Power BI file that needs a little cleaning. Work through it. Get a feel for how raw data behaves—what needs fixing, what needs combining, what you can leave out. These small wins build muscle.\n\nOver time, you’ll want to go deeper. Try automating parts of the process. Learn how SQL can give you more control. There’s no exact moment where you \"master\" ETL—it’s more about becoming comfortable with the mess and knowing how to tame it. \n\nThe best learning still comes from doing. No course or tutorial can match the clarity you get when you fix a broken dataset on your own. And once you've done that a few times, you start to see patterns—ways to work smarter, not harder.\n\nAlso, stay curious. Keep an eye on new tools, new ways of working. ETL is changing, and staying up to date isn’t about chasing trends—it’s about making your life easier and your insights stronger.\n\nIn short, ETL is what lets you spend less time fixing data—and more time using it to answer the real questions.\n\n\n\n\n\n\n\n\n\n\n\n\n\n\n","blog_slug":"understanding-etl-a-beginner-s-perspective","published_date":"2nd June 2025"}]},{"name_and_surname":"G. Datta Deepak","short_description":"A passionate data analytics enthusiast with an academic background in Bachelor computer applications (BCA). Currently interning at Certisured, I enjoy working with data to uncover meaningful business insights and solve real-world problems through Analytics.","twitter_url":null,"linkedin_url":"www.linkedin.com/in/DattaDeepak","designation":"Data Analytics Intern","image":{"localFile":{"childImageSharp":{"gatsbyImageData":{"layout":"constrained","backgroundColor":"#b83848","images":{"fallback":{"src":"/static/0fc69d8426ef06318e3dfea4ea2e1db4/ee4c4/Whats_App_Image_2025_05_19_at_1_44_03_PM_6890c52fb4.jpg","srcSet":"/static/0fc69d8426ef06318e3dfea4ea2e1db4/90089/Whats_App_Image_2025_05_19_at_1_44_03_PM_6890c52fb4.jpg 360w,\n/static/0fc69d8426ef06318e3dfea4ea2e1db4/1ff76/Whats_App_Image_2025_05_19_at_1_44_03_PM_6890c52fb4.jpg 720w,\n/static/0fc69d8426ef06318e3dfea4ea2e1db4/ee4c4/Whats_App_Image_2025_05_19_at_1_44_03_PM_6890c52fb4.jpg 1440w","sizes":"(min-width: 1440px) 1440px, 100vw"},"sources":[{"srcSet":"/static/0fc69d8426ef06318e3dfea4ea2e1db4/27ab5/Whats_App_Image_2025_05_19_at_1_44_03_PM_6890c52fb4.webp 360w,\n/static/0fc69d8426ef06318e3dfea4ea2e1db4/88c6b/Whats_App_Image_2025_05_19_at_1_44_03_PM_6890c52fb4.webp 720w,\n/static/0fc69d8426ef06318e3dfea4ea2e1db4/8d77c/Whats_App_Image_2025_05_19_at_1_44_03_PM_6890c52fb4.webp 1440w","type":"image/webp","sizes":"(min-width: 1440px) 1440px, 100vw"}]},"width":1440,"height":1440}}}},"blogs":[]},{"name_and_surname":"Laxmikanth","short_description":"I’m Laxmikanth, currently pursuing Business Analytics at Certisured, alongside a 4-month internship. I have practical experience with tools such as Power BI, Excel, SQL, Tableau, and a strong foundation in statistics and data modeling. My expertise lies in data analysis, visualization, transformation, and manipulation to extract actionable business insights.","twitter_url":null,"linkedin_url":"https://www.linkedin.com/in/laxmikanth-k-559b74328/","designation":"Business Analytics Intern","image":{"localFile":{"childImageSharp":{"gatsbyImageData":{"layout":"constrained","backgroundColor":"#080808","images":{"fallback":{"src":"/static/1b1b959141115763c6925e92c3191a63/90b11/Whats_App_Image_2025_05_27_at_5_33_52_PM_575dde5e9c.jpg","srcSet":"/static/1b1b959141115763c6925e92c3191a63/15a93/Whats_App_Image_2025_05_27_at_5_33_52_PM_575dde5e9c.jpg 98w,\n/static/1b1b959141115763c6925e92c3191a63/3a9a0/Whats_App_Image_2025_05_27_at_5_33_52_PM_575dde5e9c.jpg 196w,\n/static/1b1b959141115763c6925e92c3191a63/90b11/Whats_App_Image_2025_05_27_at_5_33_52_PM_575dde5e9c.jpg 392w","sizes":"(min-width: 392px) 392px, 100vw"},"sources":[{"srcSet":"/static/1b1b959141115763c6925e92c3191a63/a576a/Whats_App_Image_2025_05_27_at_5_33_52_PM_575dde5e9c.webp 98w,\n/static/1b1b959141115763c6925e92c3191a63/33e17/Whats_App_Image_2025_05_27_at_5_33_52_PM_575dde5e9c.webp 196w,\n/static/1b1b959141115763c6925e92c3191a63/6679b/Whats_App_Image_2025_05_27_at_5_33_52_PM_575dde5e9c.webp 392w","type":"image/webp","sizes":"(min-width: 392px) 392px, 100vw"}]},"width":392,"height":380.99999999999994}}}},"blogs":[{"title":"Power BI for Business: Building Smart Interactive Dashboards","Descrption":"### **Introduction**\nPower BI, launched on July 24, 2015, is a powerful business analytics tool developed by Microsoft. It enables users to create interactive reports and dashboards that are visually compelling and easy to understand. Whether you're a data analyst or a business user, Power BI makes data exploration and sharing seamless and efficient.\n\n### **Main Components of Power BI**\nPower BI is composed of several key tools and platforms that work together to provide a comprehensive analytics solution:\n- **Power BI Desktop**: A Windows application used to create reports and data models with interactive visualizations. \n- **Power BI Service**: A cloud-based platform for publishing, sharing, and collaborating on Power BI reports online. \n- **Power BI Mobile**: A mobile version of Power BI that allows users to access reports and dashboards on the go via smartphones or tablets. \n- **Power Query**: A data connection and transformation tool used for cleaning and preparing data. \n- **Power Pivot**: An advanced data modeling feature within Excel and Power BI for creating relationships and calculated columns. \n- **Power View**: A visualization tool for creating dynamic dashboards, charts, and maps.\n\n### **Connecting Raw Data to Power BI**\nPower BI supports a wide range of data sources for import and connection, including:\n- **Excel & CSV Files**: Import structured or unstructured data directly from spreadsheets. \n- **SQL Databases**: Connect to databases such as SQL Server, MySQL, and PostgreSQL. \n- **Power Query**: Clean, transform, and shape data before loading it into your reports.\n\n### **Basic Data Transformation in Power BI**\nData transformation is essential to prepare raw data for analysis. It includes:\n- **Data Cleaning**: Removing duplicates, correcting errors, and handling missing values. \n- **Data Shaping**: Modifying the structure of data by splitting columns, merging tables, or pivoting data. \n- **Data Modeling**: Creating logical relationships between datasets to enable meaningful analysis.\n\n### **Power BI Query Editor**\nPower Query Editor is a powerful, user-friendly tool in Power BI that allows users to clean, reshape, and consolidate data before analysis—without the need for advanced programming skills.\n\n### **Cleaning and Shaping Data in Power BI**\nTo ensure accurate analysis and visualization, Power BI provides several options for cleaning and shaping data:\n- Remove duplicates and correct errors \n- Handle missing values \n- Change data types \n- Split and merge columns \n- Apply filters and sorting \n- Create relationships between tables\n\n### **Data Modeling: Relationships and Schema**\nData modeling involves structuring data and defining relationships to optimise performance and ensure analytical accuracy:\n- **Relationships Between Tables**: Use primary and foreign keys to establish logical connections. \n- **Star Schema**: Best practice design with a central fact table connected to one or more dimension tables. \n- **Snowflake Schema**: A normalised form of the star schema, used for more complex data models.\n\n### **Visualizations and Dashboards in Power BI**\nPower BI enables the creation of dynamic dashboards that support real-time filtering and data exploration. Transform raw data into actionable insights using a wide variety of visualization tools, such as:\n- Line charts \n- Bar and column charts \n- Maps \n- Cards \n- Slicers \n- Stacked charts \n- Donut and pie charts \n- Funnel charts \n\nThese visualizations can be combined on interactive dashboards that are tailored to business needs, enabling better decision-making.\n\n\n\n\n### **Conclusion**\nPower BI empowers businesses to turn complex data into clear, interactive visuals. By understanding its components, mastering data transformation, and creating insightful dashboards, users can unlock the full potential of their data and drive smarter business decisions.\n","blog_slug":"power-bi-for-business-building-smart-interactive-dashboards","published_date":"29th May 2025"}]},{"name_and_surname":"S. Sowndarya ","short_description":"I'm Sowndarya, a passionate data analyst currently pursuing a Data Analytics program at Certisured with a 7-month internship. Skilled in Power BI, Excel, SQL, and Python, I focus on data modeling, transformation, and visualization. I aim to deliver actionable insights that drive smart business decisions and boost productivity.","twitter_url":null,"linkedin_url":"https://www.linkedin.com/in/sowndarya-songappan-298430201/","designation":"Data Analyst Intern","image":{"localFile":{"childImageSharp":{"gatsbyImageData":{"layout":"constrained","backgroundColor":"#f8f8f8","images":{"fallback":{"src":"/static/4cfb7bff2a17eb56f68df6b158ef9efc/7b079/Whats_App_Image_2025_06_03_at_4_16_25_PM_c129ef6fea.jpg","srcSet":"/static/4cfb7bff2a17eb56f68df6b158ef9efc/dcaf8/Whats_App_Image_2025_06_03_at_4_16_25_PM_c129ef6fea.jpg 300w,\n/static/4cfb7bff2a17eb56f68df6b158ef9efc/92b04/Whats_App_Image_2025_06_03_at_4_16_25_PM_c129ef6fea.jpg 600w,\n/static/4cfb7bff2a17eb56f68df6b158ef9efc/7b079/Whats_App_Image_2025_06_03_at_4_16_25_PM_c129ef6fea.jpg 1200w","sizes":"(min-width: 1200px) 1200px, 100vw"},"sources":[{"srcSet":"/static/4cfb7bff2a17eb56f68df6b158ef9efc/4fdb9/Whats_App_Image_2025_06_03_at_4_16_25_PM_c129ef6fea.webp 300w,\n/static/4cfb7bff2a17eb56f68df6b158ef9efc/6f6c7/Whats_App_Image_2025_06_03_at_4_16_25_PM_c129ef6fea.webp 600w,\n/static/4cfb7bff2a17eb56f68df6b158ef9efc/0aa83/Whats_App_Image_2025_06_03_at_4_16_25_PM_c129ef6fea.webp 1200w","type":"image/webp","sizes":"(min-width: 1200px) 1200px, 100vw"}]},"width":1200,"height":1600}}}},"blogs":[{"title":"5 tools to boost productivity in data analytics","Descrption":"### **1. Power BI Dashboard Powerhouse:**\nPower BI is a business analytics tool from Microsoft. Users can create interactive dashboards and reports for their needs and also connect with a wide variety of data sources.\n\n**Why it boosts productivity:**\n\nPower BI turns complex datasets into clean and structured formats with the help of Power Query, allowing for easy analysis to find the advantages and disadvantages related to predictions for the future, improve productivity, and create interactive and real-time dashboards within minutes. Automation data refreshing, scheduled updating hourly or weekly (trigger refresh, scheduled refresh, on-demand refresh, and direct query refresh are the types of schedule). \n\nIn Power BI, more visual graphs are there that are used to create interactive dashboards easily. Its user-friendly interface (drag and drop the fields) is easy for beginners. \n\nKPI helps to indicate the target values and compare actual profit with target profit. It views the almost reached place and finds how much percentage to reach our goal. \n\nDAX language is used to create advanced calculation and aggregation functions, it is super-fast compared with other fields. Based on that, we create visuals, and it is suitable for additional custom visuals as well, and explore KPI and specific-downs (tables have relationships). Example: country, region, state, city. \n\n**Example:** Power BI used to analyze EuroMart sales and global superstore sales, reducing reporting time by 60%.\n\n### **2. MySQL—Mastering the data—Structured Querying Database:**\nSQL—Structured Query Language is used to manage relational databases (primary and foreign keys) like data management, powerful data querying, high performance for large datasets widely supported by all major dataset systems, easy to learn, and essential for data analysis.\n\n**Why it boosts productivity:**\n\nSQL is the basis for a data analyst's skill set, it structures data in a tabular form. It is mostly suitable for large datasets for querying data, and it generates insights without needing to export data into Excel or Python. SQL queries using common table expressions make code easier to maintain and debug. (select, from, where, group by, order by, limit, offset—these are the steps used in code). Joins are also important to combine tables based on related columns for analysis, creating tables helps to create a new dataset to their needs, and sub-query, call function, partition, group by, and rank function help to sort input for analysis. \n\n**Example:** In the EuroMart sales project; it helps to segment customers and calculate frequency and monetary values to understand the purchasing behavior of customers, tailor marketing efforts, and analyze peak order times efficiently.\n\n### **3. Python—Automation—ETL Process:**\nPython is a high-level interpreted programming language known for its simplicity and readability , extensive libraries, object-oriented nature, strong community support, and simple syntax for rapid development.\n\n**Why it boosts productivity:**\n\nPython, automate tasks that used to take hours, like cleaning (remove duplicates, fill the suitable values in missing rows, and reduce inconsistencies) and running advanced analytics. Extensive libraries like pandas (data manipulation), Matplotlib (basic visualization), seaborn (advanced visualization), and scipy (statistical analysis) are lifesavers. Use Jupyter notebooks for interactive analysis and documentation. In Python we use types of operation, range functions, conditional statements, handling datasets, exceptional handling, decorators, OOP functions, and modules. Build reusable scripts for repeatable tasks like EDA (Exploratory Data Analysis). \n\n**Example:** In global superstore raw dataset and output clean visuals, saving 70 minutes per analysis.\n\n### **4. Excel—Good tool with the right trick:**\nMicrosoft Excel is a widely used spreadsheet program primarily used for organizing, analyzing, and manipulating data. It's a powerful tool for performing various calculations, creating charts using pivot tables, and generating reports. For automation, use macros and the Visual Basic Editor.\n\n**Why it boosts productivity:**\n\nDon’t underestimate Excel because it has pivot tables, power query, and conditional formatting. Excel can slice and dice data without writing complex code. It's better to learn shortcut keys and create templates for repeated tasks. \nExplore Power Query inside the Get Data feature for data transformation and create visual graphs using Pivot or PowerPivot Tables. \n\n**Example:** Ola and Pizza sales use dashboard in Excel to understand trend patterns using dynamic charts and slicers.\n\n### **5. Notion/Google Keep—Knowledge Management:**\n**Why it boosts productivity:** \n\nUsers used to lose a lot of time switching between tasks and searching for old code , but now it's useful to stay organized using Notion to document user analysis and save reusable snippets of code and track the projects and work much more efficiently and easily to manage and automate tasks.\n\n### **Conclusion:**\nThe real game changer is using these tools to analyze datasets efficiently. Each tool plays a role, and together they make users a faster, smarter, and more efficient analyst.\n","blog_slug":"5-tools-to-boost-productivity-in-data-analytics","published_date":"3rd June 2025"}]},{"name_and_surname":"Yuvraj kumar","short_description":"Yuvarajkumar is a passionate Data Analyst with hands-on experience in Excel, SQL, Power BI, and Python. He specializes in uncovering hidden patterns within data and turning complex business problems into actionable, data-driven solutions. His work bridges the gap between raw information and impactful decision-making.","twitter_url":null,"linkedin_url":"LinkedIn linkedin.com/in/yuvaraj-kumar-205704354","designation":"Data Analyst Intern","image":{"localFile":{"childImageSharp":{"gatsbyImageData":{"layout":"constrained","backgroundColor":"#f8f8f8","images":{"fallback":{"src":"/static/b1aaea73da5c45ad18169877b777b368/bc76a/Whats_App_Image_2025_06_09_at_5_09_10_PM_a1e935090e.jpg","srcSet":"/static/b1aaea73da5c45ad18169877b777b368/e4f8f/Whats_App_Image_2025_06_09_at_5_09_10_PM_a1e935090e.jpg 436w,\n/static/b1aaea73da5c45ad18169877b777b368/52f87/Whats_App_Image_2025_06_09_at_5_09_10_PM_a1e935090e.jpg 871w,\n/static/b1aaea73da5c45ad18169877b777b368/bc76a/Whats_App_Image_2025_06_09_at_5_09_10_PM_a1e935090e.jpg 1742w","sizes":"(min-width: 1742px) 1742px, 100vw"},"sources":[{"srcSet":"/static/b1aaea73da5c45ad18169877b777b368/96a48/Whats_App_Image_2025_06_09_at_5_09_10_PM_a1e935090e.webp 436w,\n/static/b1aaea73da5c45ad18169877b777b368/739a9/Whats_App_Image_2025_06_09_at_5_09_10_PM_a1e935090e.webp 871w,\n/static/b1aaea73da5c45ad18169877b777b368/00340/Whats_App_Image_2025_06_09_at_5_09_10_PM_a1e935090e.webp 1742w","type":"image/webp","sizes":"(min-width: 1742px) 1742px, 100vw"}]},"width":1742,"height":1742}}}},"blogs":[{"title":" The Role of a Data Analyst: Skills, Tools, and Responsibilities","Descrption":"**Introduction**
\n In today’s data-driven world, companies make strategic decisions based on insights extracted from raw data. At the centre of this transformation is the Data Analyst — a professional who bridges the gap between data and decision-making.
\nAs a data analyst, I’ve seen first and how valuable structured data, proper tools, and analytical thinking can be to a business. Whether you’re exploring this as a career or want to understand what analysts do, this blog will walk you through the key skills, tools, and responsibilities that define this role.\n\n\n**What Does a Data Analyst Do?**
\nA Data Analyst is responsible for collecting, organising, analysing, and interpreting large sets of data to help organisations make informed decisions.
\nKey responsibilities typically include:
\n- Collecting and cleaning data from various sources\n- Analysing trends and patterns to draw meaningful insights\n- Creating visualisations and dashboards for reporting\n- Helping teams make data-backed decisions\n- Collaborating with business stakeholders, engineers, and management\n\n\n\n\n\n\n**Tools Every Data Analyst Should Know**
\nData analysts rely on a range of tools to handle everything from data preparation to visualisation. Here are some of the most essential\n\n**Data Handling**
\n**SQL** – For querying and managing data in relational databases
\n**Excel** – For data wrangling, formulas, pivot tables, and quick summaries\n\n**Data Visualisation**
\n**Power BI**– Microsoft’s intuitive and powerful dash boarding tool
\n**Matplotlib / Seaborn**– Python libraries for plotting and visualisation\n\n **Programming & Scripting**
\n**Python** – For automating analysis, data cleaning, and machine learning\n\n**Data Storage / Query Platforms**
\n**MySQL / PostgreSQL** – Widely-used open-source databases\n\n**Essential Skills of a Data Analyst**
\nSuccess in data analysis isn't just about knowing tools. It’s about how you use them. Here are the top skills every analyst must master:
\n\n1. Analytical Thinking
\nThe ability to break down complex problems and analyse them from different angles.
\n\n2. Statistical Knowledge\nUnderstanding distributions, correlations, sampling, and hypothesis testing.\n\n3. Data Cleaning & Preparation\nHandling missing values, duplicates, inconsistent formats, and outliers — crucial before any analysis.\n\n4. Communication Skills\nYou must present insights clearly to non-technical stakeholders, often through storytelling and visualisations.\n\n5. Domain Knowledge\nUnderstanding the industry, you're analysing (e.g., finance, retail, healthcare) makes your insights more impactful.\n\n**A Typical Day of a Data Analyst**
\n\n\nA day in the life of a data analyst might include:
\n- Writing SQL queries to extract data from a company database\n- Cleaning and transforming data using Python\n- Creating a sales dashboard in Power BI\n- Preparing a report for marketing on customer churn\n- Presenting insights to the business team\n\n**Conclusion**
\nThe role of a data analyst is growing rapidly, offering endless opportunities to learn and make a real impact. It’s not just about crunching numbers — it’s about solving problems, telling stories with data, and driving smarter decisions.
\nIf you're someone who loves patterns, logic, and storytelling, a career in data analysis could be the perfect fit.\n\n\n\n\n\n","blog_slug":"the-role-of-a-data-analyst-skills-tools-and-responsibilities","published_date":"9th June 2025"}]}]}},"pageContext":{"blog_slug":"power-bi-s-role-in-modern-transformation"}},
"staticQueryHashes": ["1220268427","1701577168","2407462765"]}